Haver Analytics
Haver Analytics

Featured Data Additions: 2026

  • EMERGEPRPhilippines → Public Finance and Debt → Holders of Onshore Government Securities

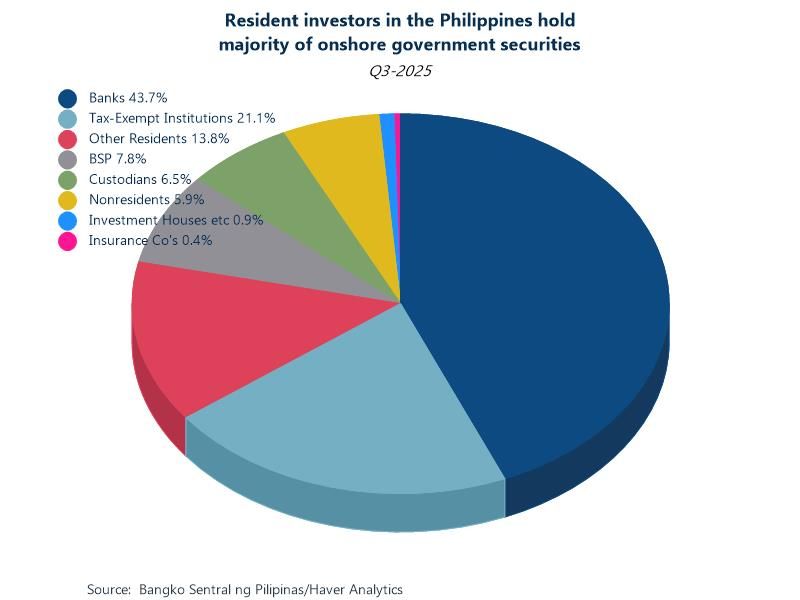
    Ownership of onshore government securities statistics for the Philippines were added to EMERGEPR. Onshore securities are issued within the Philippines in Pesos targeting the domestic investor base. These series are reported as percentage shares of the total and cover the major holders. Quarterly data are sourced from the Central Bank of the Philippines and start in Q2 2022.

    Chart: As of the end of September 2025, foreign holdings of onshore peso government securities rose to 5.9% from 5.1% at the end of Q2 2025. These percentages are significantly higher than only two years ago when the share was 1.7%. Meanwhile, resident investors held the remaining 94.1% of onshore government securities, with banks holding the largest share at 43.7%, followed by tax-exempt institutions (21.1%), other residents (13.8%), and the Central Bank of the Philippines (7.8%).

  • GLSECTOR → Competitiveness Measures → Bellwether Company Statistics → Microsoft

    Financial statistics for Microsoft were added to the bellwether company section of GLSECTOR. Key headline concepts for income, revenue, and capex are available. Quarterly data are sourced from MS’s SEC filings and start in Q3 2015.

    Chart: Microsoft’s latest report initially appeared to be a triumph, but over the next week, the stock price tumbled by 18%. Total revenue was reported at $81.3b, a 17% YoY increase, beating analyst estimates. However, the net income of $38.5b was bolstered by a one-time $7.6b accounting gain from the recapitalization of its stake in OpenAI, which is an accounting adjustment rather than an operational profit. The key issue was the rapidly rising capex, which reached $37.5b, representing a 66% YoY increase - much of it tied to AI infrastructure. The question for shareholders is whether the ROI can keep pace with the massive infrastructure bill.

  • SPAIN → Manufacturing, Trade and Services → E-Commerce Transactions or Business Volume

    E-commerce statistics for Spain were added to the SPAIN database. Number of transactions and sales reported in euros are available with detail by type of activity and region – for example, within Spain, from abroad with Spain, or from Spain to abroad. Quarterly data are sourced from Comision Nacional del los Mercados y la Competencia and start in Q4 2013.

    Chart: Spain’s e-commerce market posted double-digit QoQ growth in Q2 2025, reaching record sales of 28.3 billion euro, up 22.6% YoY. The number of transactions also climbed, by 16.8% YoY, to more than 493 million. 31.6% of the spending was domestic, between Spanish sellers and buyers, while the revenues of transactions originating in Spain that were sent to foreign locations accounted for 54.2% of the total, the vast majority to the EU.

  • CRYPTO → Decentralized Finance → Blockchain Distribution

    Stablecoin circulation by blockchain statistics were added to CRYPTO. Two hundred and fifty-four stablecoins are tracked across 158 blockchains giving you insights into the layout of the stablecoin ecosystem. These daily data are sourced from DeFiLlama and start as early as November 2017.

    Chart: Stablecoins circulate on multiple blockchains to enhance liquidity, increase utility across diverse decentralized applications, and to provide users with transaction speed and cost flexibility. $185 billion of USDT is circulating across 100 blockchains - 90% on Ethereum, Tron, and Solana. Ethereum acts as the primary network for institutional, high-value, and decentralized finance interactions. Tron is widely used for its cost-effective, high-volume transactions. Solana has emerged as a leading chain due to its high speed and low-cost transaction capabilities for everyday commerce.

  • EMERGECWRussia → Financial → Deposits and Funds of Legal Entities and Individuals

    Deposits and funds of legal entities and individuals statistics for Russia were added to EMERGECW. Both ruble- and foreign currency denominated deposits are available for organizations, legal entities, individuals and entrepreneurs. Monthly data are sourced from the Central Bank of Russia and start in January 2012.

    Chart: Russians have amassed a record amount of bank deposits as they take advantage of historically high interest rates in the wartime economy. Upon the invasion of Ukraine in 2022, panicked depositors rushed to withdraw cash. The central bank moved quickly to hike its key interest rate to 20% in an emergency step to stem the outflow. Rates were hiked again starting in 2023 to curb accelerating inflation. The extended period of high interest rates has made ruble deposits one of the most profitable investments in the country and has led to a doubling of deposits since 2022.

  • EIULIVE → EIU Global Liveability Index

    A new database (EIULIVE) containing EIU’s Global Liveability Index was added to the Haver offering. These data assess which cities around the world offer the best and worst living conditions. 173 cities are assigned a score for over 30 qualitative and quantitative factors across 5 broad categories: stability, healthcare, culture & environment, education and infrastructure. The scores are then compiled and weighted to derive category ratings. An overall rank is also available. These annual data start in 2009.

    Chart: Al Khobar saw the biggest improvement since last year with its overall rating increasing by 2.5 in 2025 improving its overall rank by 13 (#135 overall). Saudi Arabia is investing heavily in improving access to healthcare and education under their Vision 2030 program. Calgary was ranked #5 overall in 2024 and saw a 2.1 point decrease in its overall rating in 2025 causing its rank to plummet by 13 places which now sits at #18. Strains in the country’s national health service intensified lowering Calgary’s healthcare score.

  • ANZR/ANZ → Public Finance → Early Childhood Education: Child Care Subsidy (CCS)

    Child care subsidy (CCS) statistics for Australia were added to the ANZ and ANZR databases. Series include number of children using approved child care, number of families, number of approved services, and the estimated CCS in Australian dollars. These data are available by state and territory. Quarterly data are sourced from the Department of Education and start in Q4 2012.

    Chart: 1,451,860 children from 1,020,930 families were allocated a Customer Reference Number (CRN) by Services Australia in Q3 2025, down 0.13% from Q3 2024. New South Wales had the largest share of children attending approved care, at 31.7% or 460,610 children. Victoria had the largest proportional YoY increase, at 1.03% or 3,700 children.

  • SURVEYS → Federal Reserve Surveys and Indicators → FRB Chicago → Labor Market Indicators

    The Labor Market Indicators data set introduced in September 2025 by the Federal Reserve Bank of Chicago were added to the SURVEYS and USECON databases. These data, updated twice monthly, are designed to provide a more frequent and predictive look at national employment trends. Forecast data include a layoffs and other separations rate, the hiring rate for unemployed workers, and the unemployment rate.

    Chart: These December data were released prior to December BLS Employment Situation. At the time, the relative odds of a decrease in the unemployment rate, as predicted by this model, was 47% - with a 28% chance of no change – and 25% odds of an increase. Of the decreases, there was a 26.3% chance of a 0.1% decrease. The official unemployment rate released on January 9th decreased from 4.5% to 4.4%.