 Global| Mar 11 2026
Featured Data Additions, March 11, 2026
CANADA → Financial → Debt Securities by Sector, Currency, Maturity, Type of Interest Rate
Over 5,000 series relating to Canadian debt securities issues were added to CANADA. Detail is available by sector (private vs public), currency (C$ vs foreign currency), maturity (ST vs LT), type of interest rate (fixed vs variable) and market of issuance (domestic vs foreign). These quarterly data are sourced from Statistics Canada and start in Q1 2012.
Chart: The stock of Canadian debt securities, in book value terms, reached $6,321 billion at the end of Q3, up $127 billion from the previous quarter. By sector of issuer, the stock issued by governments was the highest, at $2,822 billion, followed by financial corporations ($2,580 billion) and non-financial corporations ($919 billion). The government sector became the main borrowing sector starting in Q1 2021, a period marked by strong borrowing needs related to the COVID pandemic.

UK → Employment, Earnings, Productivity & Costs → Redundancies → Potential Redundancies from HR1 Forms
Employers in the UK are required to notify The Insolvency Service of potential redundancies via an HR1 form when they are proposing to dismiss 20 or more employees at a single establishment within a period of 90 days. These potential redundancy statistics were added to the UK database. A total plus detail for eight broad sectors is available. Monthly data are sourced from the ONS and start in April 2019.
Chart: The number of people officially at risk of redundancy jumped by 29% MoM in January to 27,279. The worst-hit sector was distribution, hotels and restaurants, where there was a 272% MoM increase to 8,165. Businesses are dealing with higher taxes and wages and are battling to cut costs. These figures were released on the heels of unemployment already being at a 5-year high of 5.2% and the jobless rate for the young soaring to an 11-year high of 16.1%.

ANZ → New Zealand → Demographics → Migration (Quarterly)
Migration statistics for New Zealand were added to the ANZ database. Series include departures and arrivals to and from Australia and to and from the rest of the world. Net series are also available. These quarterly data are sourced from Stats NZ and start in Q4 2003.
Chart: There was a net migration loss of 28,800 people to Australia in the year ended June 2025. This was made up of 19,200 migrant arrivals from Australia to New Zealand, and 48,000 migrant departures from New Zealand to Australia. New Zealand loses population to Australia primarily due to higher wages, a lower cost of living, better career opportunities, and active recruitment for skilled workers. Despite these departures, New Zealand still experiences a net gain from non-Australian migration.

EMERGEPR → Cambodia → Financial → Money, Banking and Credit → Credit Granted by Microfinance Institutions
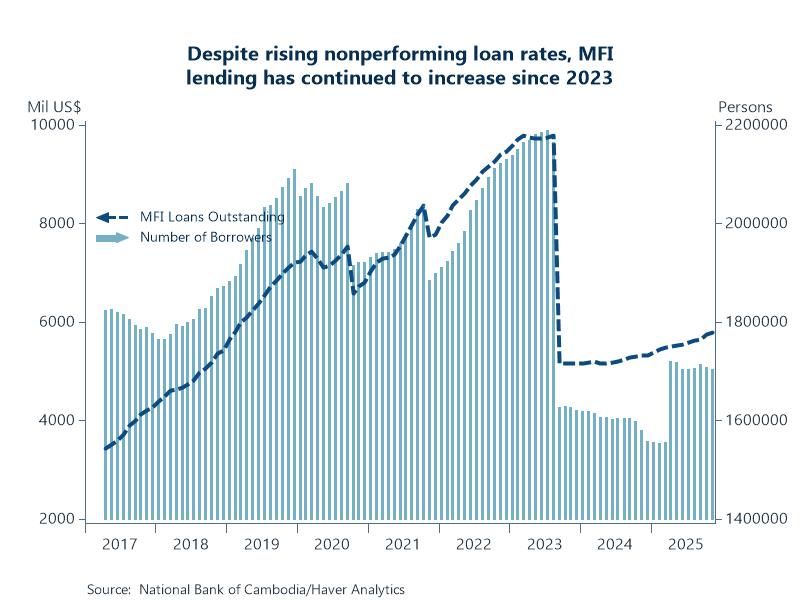
Microfinance institution statistics for Cambodia were added to the EMERGEPR database. Series include number of MFI branches, number of borrowers, and amounts of outstanding loans. These monthly data are sourced from the National Bank of Cambodia and start in April 2017.
Chart: By 2019, Cambodia had the highest microfinance debt per capita in the world, with much of its population struggling with over-indebtedness. By the end of 2023, significant decreases were driven by rising NPLs, economic slowdown, and reduced demand. This was compounded by industry-wide pressures regarding over-indebtedness, predatory lending practices, and tightening credit conditions. Since then, despite rising NPL rates, MFI lending has been increasing, but not at the double-digit rates seen prior to 2023. Loans outstanding currently stand at $5.8 billion USD.
More Featured Data Additions
 Global| Jun 26 2026
Featured Data Additions, June 26, 2026
 Global| Jun 17 2026
Featured Data Additions, June 17, 2026
 Global| Jun 12 2026
Featured Data Additions, June 12, 2026
 Global| Jun 03 2026