 Global| Apr 16 2026
Featured Data Additions, April 16, 2026
EMERGEAP → Fiji → Housing and Construction → Estimated Value of Work Put in Place
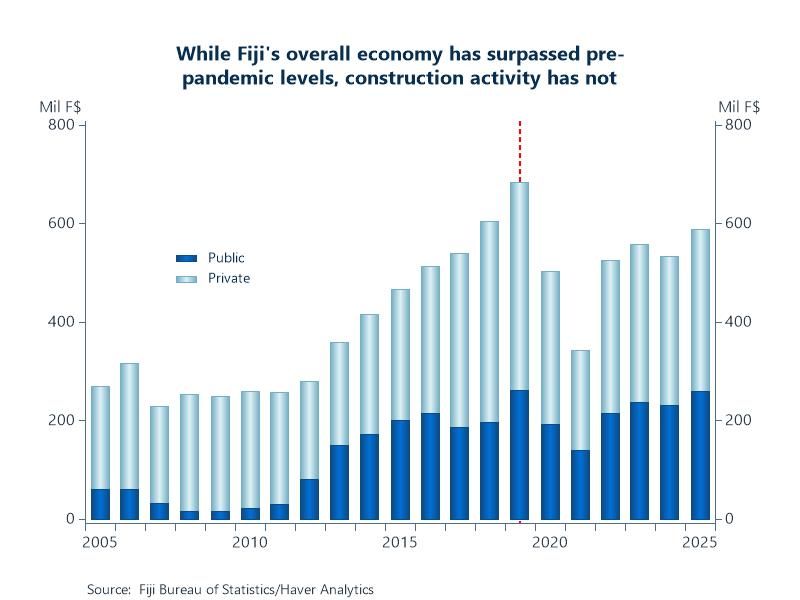
Value of construction put in place statistics for Fiji were added to EMERGEAP. Series reported in Fijian dollars are available for new buildings and capital repairs, current repairs and maintenance, and civil engineering works. Detail for private vs public is available for each. Quarterly data are sourced from the Fiji Bureau of Statistics and start in Q1 2005.
Chart: Total estimated value of work put in-place stood at $589.1 million for 2025, an increase of 0.8% ($4.5 million) when compared to 2024. Despite this increase, construction activity remains below its 2019 peak due to surging material costs (up 33% since 2019), a shortage of skilled labor (migration to AUS/NZ), a slow-building pipeline of new projects (canceled or delayed due to logistical/environmental shocks), and high government debt (projected to reach 80% of GDP this year) has limited Fiji’s ability to fund new public infrastructure projects.
EMERGEPR → Taiwan → Public Finance and Debt → Central Government Bond Auction Results
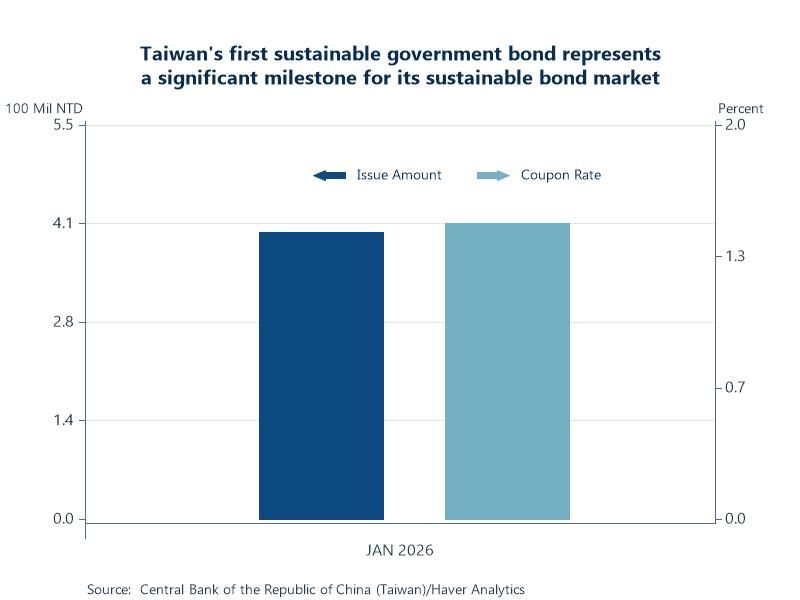
30-year sustainable bond statistics for Taiwan were added to the central government bond auction table in EMERGEPR. Series include issue and maturity dates, offering and issue amounts, the coupon rate, and yields. Sustainable bonds finance projects providing both environmental and social benefits. These monthly data are sourced from the Central Bank of the Republic of China and start in January 2026.
Chart: Taiwan’s first green central government bond was listed on the Taipei Exchange on January 30, 2026. The Ministry of Finance issued 400 mil NTD (~12.6 mil USD) of 30-year green central government bonds with a 1.50% coupon rate on behalf of National Quemoy University. Proceeds will be used to fund the construction of student dormitories certified as green buildings, highlighting the university’s commitment to the Sustainable Development Goals.
LATAMR → Brazil → National Accounts → Economic Activity Indicator
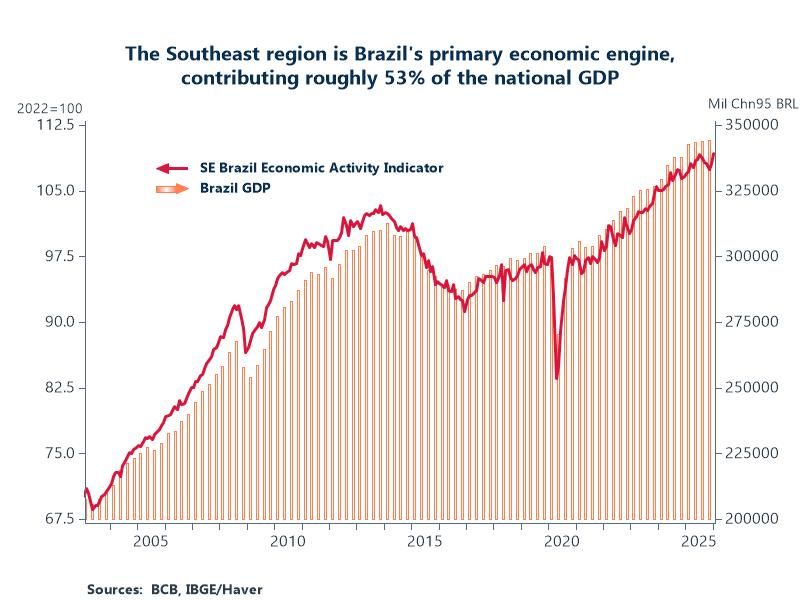
Economic activity indexes for Brazil were added to LATAMR. These data are available for the five main regions in Brazil and for thirteen states within those regions. Although these indexes use a more limited set of information than GDP, they are useful for their monthly frequency. They combine data from industry, trade, services, and agriculture, providing a timely snapshot of the country's regional economic trends. Data are sourced from the Central Bank of Brazil and start in January 2003.
Chart: The southeast region of Brazil is the principal engine of national economic activity, reflecting its focus in finance, manufacturing, and high-value services. São Paulo accounts for the largest share of output within the region, followed by Rio de Janeiro and Minas Gerais. As such, the southeast economic activity index exhibits a strong correlation with national GDP and serves as a useful higher-frequency proxy. The SE index registered an increase in January, and an additional observation will be available ahead of the Q1 GDP release in May, providing additional insight into near-term economic growth.
SURVEYS → Federal Reserve Surveys and Indicators → Employment by Federal Reserve District
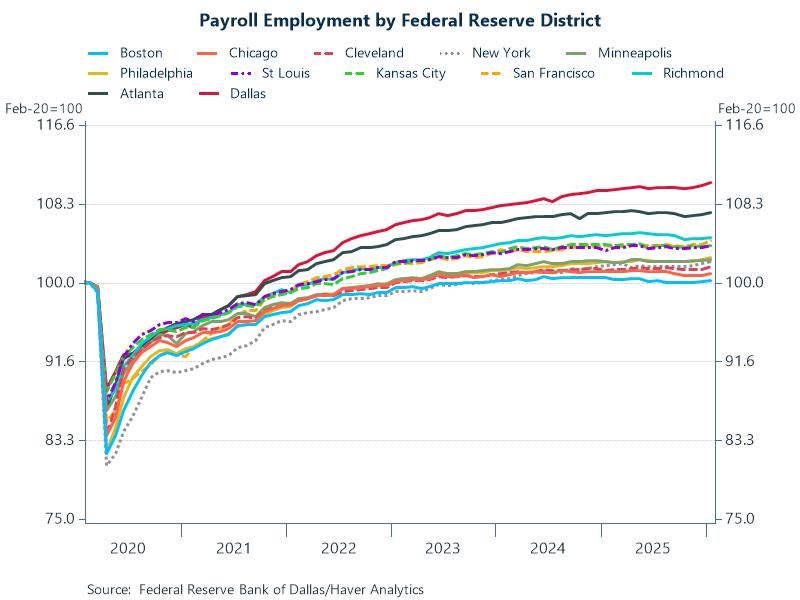
Employment levels by US Federal Reserve District were added to SURVEYS. These districts are 12 distinct regions across the US, organized to align with regional economic activity. Each is served by a regional Federal Reserve Bank that operates under the Board of Governors to manage regional economic conditions, supervise banks, and contribute to national monetary policy. Monthly data are sourced from the Federal Reserve Bank of Dallas and start in January 1990.
Chart: This chart illustrates payroll employment across each Federal Reserve District, indexed to 100 in February 2020. The sharp declines in March 2020, triggered by the onset of the pandemic, are immediately evident, along with the subsequent recovery trajectories. These recoveries, however, were not uniform across districts. The Dallas and Atlanta districts regained their pre-pandemic employment levels by October 2021, and have since followed a sustained upward trend. In contrast, districts like Boston and Chicago experienced a slower recovery, taking an additional 1-2 years to return to pre-pandemic employment levels, after which their growth has largely plateaued.
More Featured Data Additions
 Global| Jul 16 2026
Featured Data Additions, July 16, 2026
 Global| Jul 08 2026
Featured Data Additions, July 8, 2026
 Global| Jun 30 2026
Featured Data Additions, June 30, 2026
 Global| Jun 26 2026