 Global| Apr 02 2026
Featured Data Additions, April 2, 2026
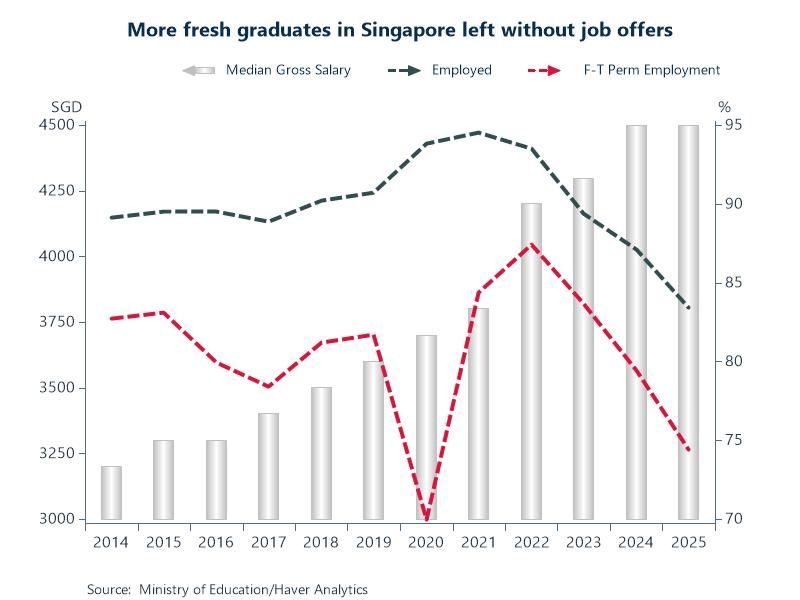
EMERGEPR → Singapore → Employment and Earnings → Graduate Employment Survey
The Graduate Employment Survey for Singapore was added to EMERGEPR. This survey is conducted annually by the six Autonomous Universities in Singapore to collect information regarding the employment status of graduates 6 months after taking final exams. Employment rates by type of employment and by type of graduates are available in addition to median gross salary series. Data are sourced from the Ministry of Education and start in 2014.
Chart: Latest results show that 83.4% of graduates found employment within 6 months, down from 87.1% in 2024 – the fourth consecutive annual decline. 74.4% of graduates secured FT positions in 2025, down from 79.4% in 2024 – the third consecutive annual decline. Among those who found FT jobs, the median gross monthly salary remained at S$4,500, the first non-increase since 2016. These results may be due to a combination of cyclical economic caution and structural changes in the labor market, such as how entry-level jobs may be increasingly automated by AI.
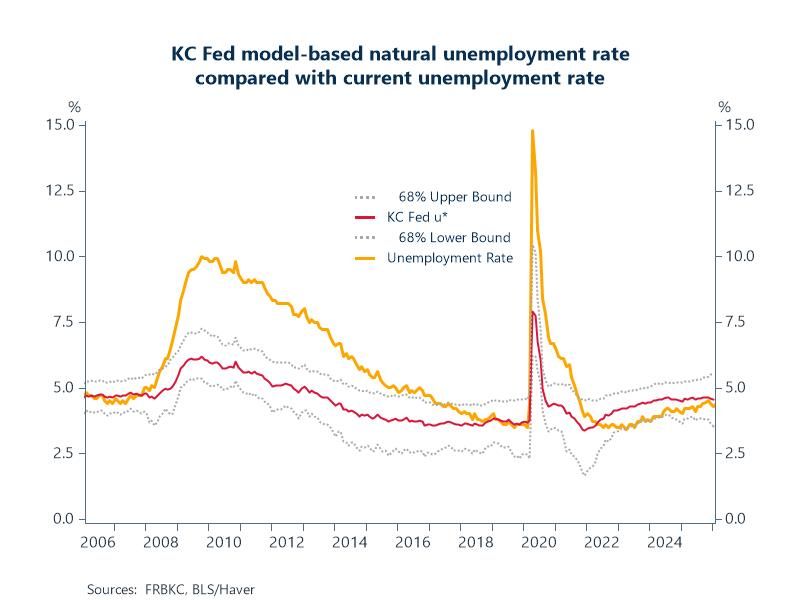
SURVEYS → Federal Reserve Surveys and Indicators → Model-Based Natural Rate of Interest and Natural Unemployment Rate
The KC Fed natural rate of interest (r*) and natural unemployment rate (u*) were added to SURVEYS. 68% upper and lower bound estimates are also available. Policymakers reference r* to judge the tightness of monetary policy and u* to gauge whether the economy is near full employment. These monthly series are more timely than other sources of r* and u*. Data start in July 1966.
Chart: u* suggests that labor markets remained slack following the GFC. While u* increased at the onset of the GFC, actual unemployment increased significantly more. For the following decade, a gap persisted between the two despite low policy rates, suggesting the labor market remained loose even as growth recovered. More recently, u* suggests that while labor markets were initially slack at the onset of the pandemic in 2020, they tightened quickly over the next 2 years. u* suggests that unemployment was below its natural rate by mid-2022, when labor markets were tighter than at any time since the late 1990s.
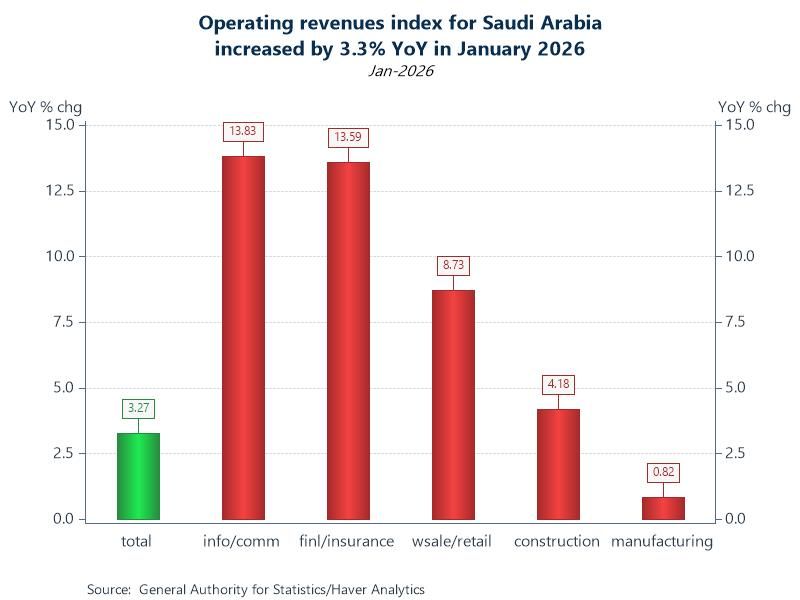
EMERGEMA → Saudi Arabia → Financial → Short-Term Business Indicators
Short-term business indicator statistics for Saudi Arabia were added to EMERGEMA. Concepts include operating revenues, employee compensation, bankruptcies and building permits. Where available, levels and weights are present by ISIC4 economic activity classification. Monthly data are sourced by the General Authority for Statistics and start in January 2023.
Chart: In January 2026, the operating revenues index for Saudi Arabia increased by 3.3% YoY, driven by increases of 13.8% and 13.6% in information & communication activities and financial & insurance activities, respectively. Wholesale and retail trade increased by 8.7% and construction activities by 4.2%. Manufacturing activities increased by a modest 0.8% YoY, but they command roughly one third of the total weight.
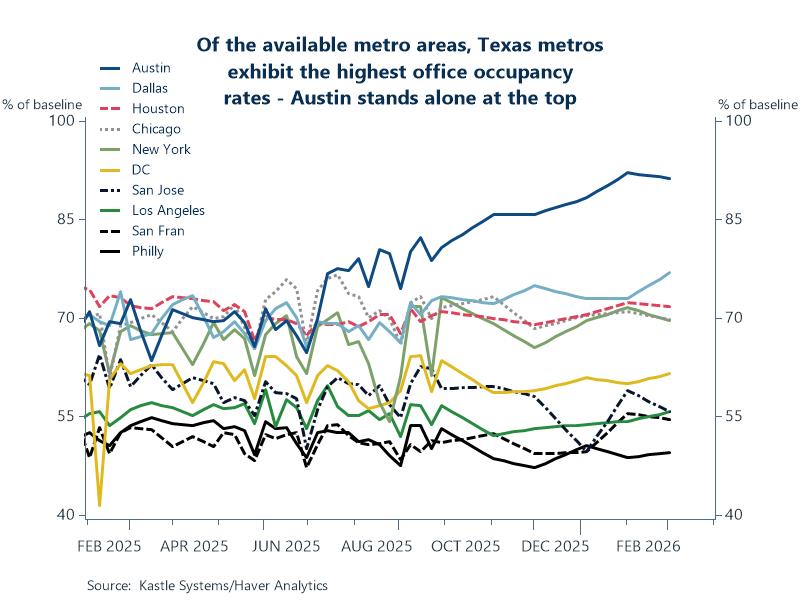
GLSECTOR → Business Services and Employment → Peak Day Hybrid Index
Peak day hybrid indexes for the US were added to GLSECTOR. These series measure office occupancy on Tuesdays, which is typically the day peak occupancy is achieved in today’s hybrid work environment. The values are reported as percentages relative to a pre-pandemic baseline for 10 major US metro areas. Weekly data are sourced from Kastle Systems and start in October 2024.
Chart: The three Texan metro areas represented in this data set have the highest office occupancy rates with Austin registering over 91% followed by Dallas and Houston at 77% and 72%, respectively. Chicago, NYC and DC come in between 62-69%. The California metro areas are all come in at around 55% and Philadelphia rounds it out at under 50%. Higher Texas rates may be driven by a combination of corporate culture, a younger work force that is often more required to be on-site and less resistance to returning to the office compared to more liberal-leaning, high-density metro areas.
More Featured Data Additions
 Global| Jun 26 2026
Featured Data Additions, June 26, 2026
 Global| Jun 17 2026
Featured Data Additions, June 17, 2026
 Global| Jun 12 2026
Featured Data Additions, June 12, 2026
 Global| Jun 03 2026