- Claims rose 12,000 but below recent peak in week of June 10.
- Continuing claims fell further to lowest level since February.
- Insured unemployment rate unchanged at 1.2% for tenth straight week.
 USA| Jul 06 2023
Initial Unemployment Claims Remain Elevated
by:Sandy Batten
|in:Economy in Brief
 USA| Jul 06 2023
U.S. Mortgage Applications Declined in the Latest Week
- Mortgage applications declined in the week ended June 30 after three consecutive weekly increases.
- The effective rates on fixed loans rose in the latest week, while the adjustable rate declined.
- The average loan size declined in the latest week.
 Germany| Jul 06 2023
German Orders Rebound Strongly in May- Without Much Consequence
German real orders in May grew strongly, rising 6.4% month-to-month with foreign orders rising 6.4% and domestic orders rising 6.2%. There are back-to-back monthly increases in total orders and in domestic orders. However, March saw even weaker orders with total orders falling by 10.9% month-to-month, foreign orders falling by 13.2%, and domestic orders falling by 7.7%. The strength in May reflects an unwinding of some of the weakness in March, albeit with a one-month lag.
Domestic vs. foreign growth trends in orders Because March was so weak, the three-month change in orders continues to be negative for Germany. Total orders are down by 4.1% over 12 months; they rebound to log a 3.2% annual rate of growth over 6 months, but then they are declining at an 18.7% annual rate over 3 months. This sequence is repeated for foreign orders that fall by 6% over 12 months, have a small 0.4% annual rate gain over 6 months and then decline at a 29.6% annual rate over 3 months. Domestic orders fall by 1.3% over 12months, rise by 7% at an annual rate over 6 months and then execute a small decline at a 0.4% annual rate over 3 months. For now, the greater weakness is in foreign orders on the recent horizon as well as over 12 months.
Real sector sales patterns Real sales by sector also show strength with gains across consumer goods, capital goods and intermediate goods in May. Within the consumer goods sector, consumer durables spending falls by 0.1% in May, the only sector or subsector to register a decline in the month.
Sector sales do not show any clear trends over the sequential period from 12-months, to 6-months, to 3-months. Manufacturing sales overall show a gain of 4.2% over 12 months, a decline of 1.5% at an annual rate over 6 months, and a gain of 0.8% annualized over 3 months. There is a 4% gain in real sales over 12 months, but over 3 months and 6 months there's not much change in sales at all. Consumer goods show sales declines over 12 months and over 6 months with a rebound over 3 months. Capital goods show growth over all three horizons at a 13.6% annual rate over 12 months, slowing to a 4.2% annualized gain over 6 months and then accelerating to log a 7.8% annual rate gain over 3 months. Capital goods sales rise on all horizons but do not accelerate. In contrast, intermediate goods sales fall on all horizons and their fall gets progressively worse as intermediate goods sales fall by 4.3% over 12 months, at a 6.6% annual rate decline over 6 months and at a 7.8% annual rate decline over 3 months.
EMU Big Four economies and EU Commission indexes The EU Commission industrial confidence gauges for Germany, France, Italy, and Spain show negative readings in March, April, and May. The monthly progression for Germany shows increasing weakness. Italy shows increasing weakness. Spain and France show less straightforward results but generally look to be on a weakening path since the May reading is weaker than the March reading for each of them. Sequentially the German industrial confidence indicator weakens from an average of +4 over 12 months to +0.4 over 6 months, to -2.3 over 3 months. France also shows sequential deterioration that gets worse as does Italy; Spain breaks the pattern with the -4.1 reading over 12 months, slightly worse at a -4.2 reading over 6 months and then logging a small improvement to -3.5 over 3 months. However, there's nothing in any of those sequences that looks like it's a real improvement. The queue standings for the EU Commission readings in May show all of them below their respective 50th percentiles, a level that marks the median since 1990.
The quarter-to-date In the quarter-to-date (QTD) as of May, two months into the second quarter, orders are falling at a 13.5% annual rate, foreign orders are falling at a 24.6% annual rate, while domestic orders in Germany are rising at a 5.2% annual rate. Real sales by sector show total manufacturing sales up by 0.6% at an annual rate in the QTD with consumer durables showing a 10.8% annual rate increase in sales and capital goods logging at a 6.5% annual increase in sales. Total consumer goods, consumer nondurables and intermediate goods sales are falling out on the QTD basis.
 USA| Jul 05 2023
U.S. Light Vehicle Sales Rebound in June
- Light trucks lead the increase.
- Imports' market share remains below its high.
by:Tom Moeller
|in:Economy in Brief

- Durable goods orders advance, nondurable goods industries see decline.
- Total shipments rise after 3 monthly declines.
- Durable goods inventories rise modestly in May while nondurable goods inventories drop.
 USA| Jul 05 2023
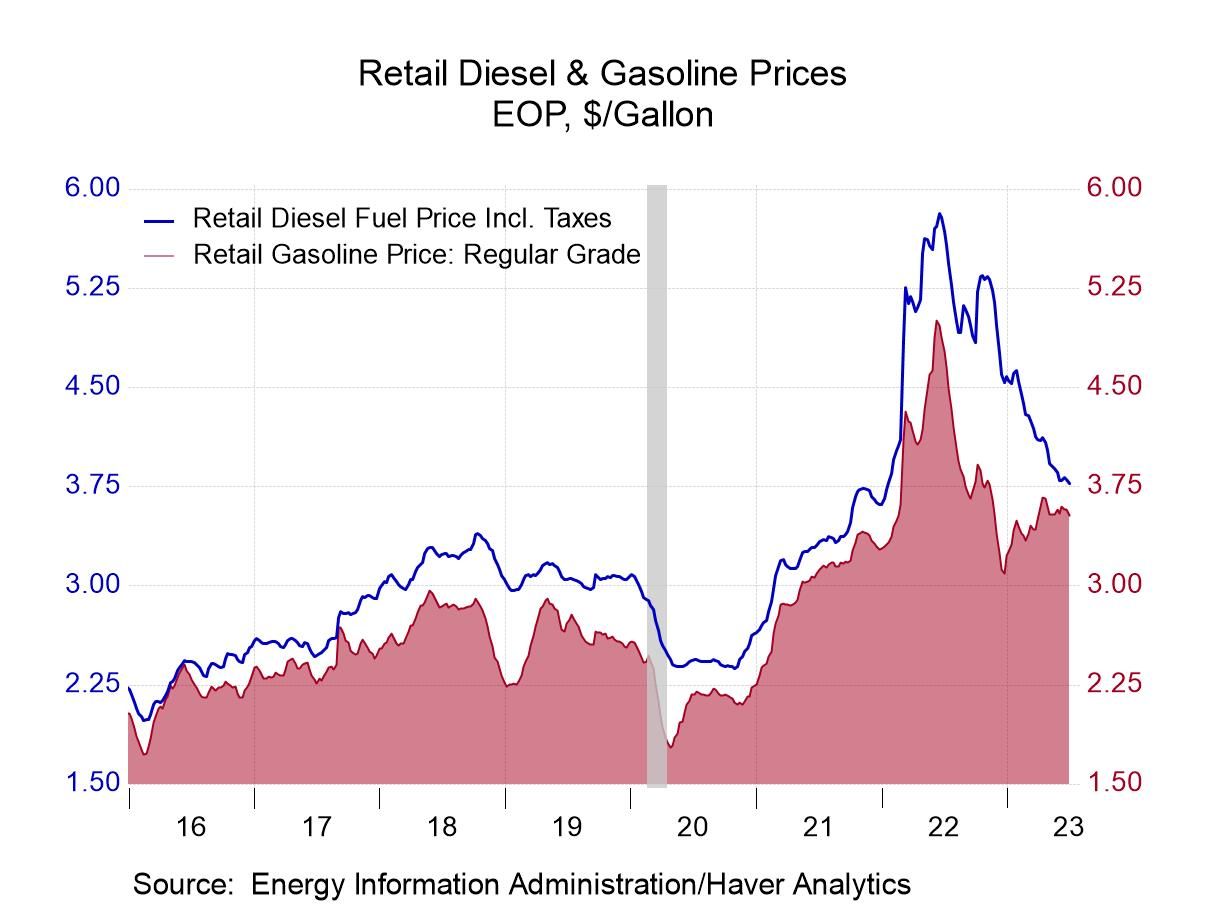
U.S. Energy Prices Are Mixed
- Gasoline prices decline to three-week low.
- Crude oil prices ease.
- Natural gas prices continue to rise.
by:Tom Moeller
|in:Economy in Brief

 Global| Jul 05 2023
Composite PMIs Weaken in June
Among the 25 countries/regions reporting composite PMIs that reflect the manufacturing and services sectors of their respective economies, only four show improvement in June. Those four are Russia, Saudi Arabia, United Arab Emirates, and Egypt. The domination of oil producers on the list is notable. We mark Zambia as unchanged as its data are unavailable in June. We use the May value for June only in the case of Zambia. This overall result is a substantial step-down and worsening from May when only 13 reporters logged worsening. In April, only 7 had cited a worsening.
The sequential averages show worsening over 3-months compared to 6-months in only seven reporters, a worsening at 6-months compared to 12-months for only five reporters and a worsening over 12-months compared to 12-months ago in 14 reporters.
Some weakening The month’s data are sharply weaker (month-to-month), showing much more breadth of weakening than what we've seen in some time although the PMI averages have not so sharply deteriorated. The average PMI stands at 52.1 in June and the 12-month average is 51.5. That compares to a 3-month average at 53.0; its 6-month average is at 52.3. This sequence shows improving PMI averages over shorter, timelier, periods (except month-to-month). The medians also show improvements from 51 over 12 months to 52.3 over 6 months to 53.0 over 3 months. However, in the month-to-month data, the April reading is 53.8, rising to 54.0 in May and then dropping to 51.5 in June. The median and the averages both show a fall-off in June; however, the PMI values remain above 50 indicating economic expansion based upon the comprehensive composite PMI readings.
Little contraction PMI readings show composite PMI is below 50 in June indicating contraction for only five countries; that compares to three in May and three in April. For the three-month average, there's only three weaker compared to six-months; for the six-month average there's only three weaker than over 12 months. For the 12-month average, there's only five weaker than a year-ago. While there is great concern about a coming global slowdown and potentially a global recession based upon composite PMIs, there aren't many countries or regions now that are experiencing contraction.
Much weakening in June On a month-to-month basis, there's a much more significant indication of slowing with 20 of 25 reporters showing weaker values in June compared to May. That compares to 13 in May compared to April and 6 for April compared to March. Over three months there are seven out of 25 that show weakening compared to six months; over six months there are five that show weakening compared to 12 months, but over 12 there are 18 that show weakening compared to 12-months ago. Even so, we can see that the tendency for weakening is mostly a month-to-month phenomenon that has emerged in June. It is not yet indicative of the broader trends.
Standings are weak and mixed The queue percentile standings place the current observations in an ordered queue of data back to January 2019; it shows the average standing at the 53.4 percentile mark and a median standing at the 50-percentile mark. That means that the median for the group over the period is at such a level that it corresponds to the median value for each reporter on average. There are 12 of 25 of the reporters with composites below the historic medians on this timeline.

- 46.0 in June vs. 46.9 in May; below 50 for the eighth consecutive month.
- New orders contract for the 10th straight month; production contracts for the sixth month in seven.
- Employment contracts following two months of expansion.
- Prices index declines to a six-month low.
- of10Go to 9 page