Global
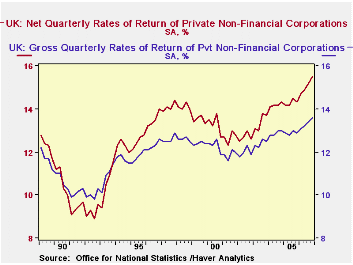 The net profitability of all private nonfinancial corporations in the United Kingdom was 15.5% in the fourth quarter of 2006. This rate was up from 15.2% in the third quarter and was the highest quarterly rate since the series began in the first quarter of 1989, as can be seen in the first chart, which shows net and gross profitability of U.K. corporations.
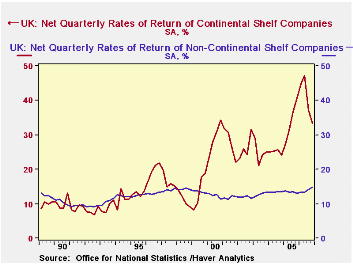 Net profitability is defined as the net rate of return on capital employed. That is, it is the value of profits, allowing for depreciation, divided by the value of inventories and the depreciated value of fixed assets. Gross profitability is defined as the gross return on capital employed, that is, the value of profits before depreciation charges divided by the value of inventories and fixed assets before depreciation . These tend to be lower than the net rates of return, as shown in the first chart.
While the net profitability of Continental Shelf companies (companies engaged in the extraction of oil and gas) declined to 33.5% from 37.3% in the third quarter, the profitability of the nonshelf companies rose to 14.7% from 14.2% in the third quarter. The rates of return for the Continental Shelf corporations are more volatile than those of the nonshelf corporations as can be seen in the second chart. The volatility of the Continental Shelf corporations is due, in large part, to variations in the prices of oil and gas.
Net profitability is defined as the net rate of return on capital employed. That is, it is the value of profits, allowing for depreciation, divided by the value of inventories and the depreciated value of fixed assets. Gross profitability is defined as the gross return on capital employed, that is, the value of profits before depreciation charges divided by the value of inventories and fixed assets before depreciation . These tend to be lower than the net rates of return, as shown in the first chart.
While the net profitability of Continental Shelf companies (companies engaged in the extraction of oil and gas) declined to 33.5% from 37.3% in the third quarter, the profitability of the nonshelf companies rose to 14.7% from 14.2% in the third quarter. The rates of return for the Continental Shelf corporations are more volatile than those of the nonshelf corporations as can be seen in the second chart. The volatility of the Continental Shelf corporations is due, in large part, to variations in the prices of oil and gas.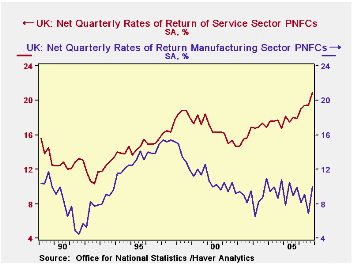
Of the nonshelf companies, it is the corporations engaged in the service industries that have accounted for the rise in the overall profitability of the private nonfinancial companies. Net profitability in the service and manufacturing industries are compared in the third chart. Rates of return in the manufacturing industry tend to be lower than those in the service industries due, in part, to the greater capital intensity of the manufacturing industry relative to that of the service industry corporations, but the gap between rates of return in the manufacturing and service industries has widened as profitability in the service industries has improved and that in the manufacturing industries deteriorated.
| NET PROFITABILITY OF PRIVATE NON FINANCIAL CORPORATIONS IN THE UK (%) | Q4 20 06 | Q3 20 06 | Q4 20 05 | Q/Q Dif | Y/Y Dif | 2006 | 2005 | 2004 |
|---|---|---|---|---|---|---|---|---|
| All Corporations | 15.5 | 15.2 | 14.3 | 0.3 | 1.2 | 15.1 | 14.3 | 14.2 |
| Continental Shelf Corporations | 33.5 | 37.3 | 40.6 | -3.8 | -7.1 | 40.7 | 34.1 | 25.1 |
| Nonshelf Corporations | 14.7 | 14.2 | 13.0 | 0.5 | 1.7 | 13.9 | 13.4 | 13.5 |
| Manufacturing Corporations | 10.0 | 6.9 | 9.9 | 3.1 | 0.1 | 8.5 | 9.3 | 9.7 |
| Service Industry Corporations | 20.9 | 19.5 | 17.9 | 1.4 | 3.0 | 19.7 | 17.9 | 17.4 |
| · The Euro area 13 PPI rose by 0.3% in February. Excluding energy the rise was 0.3% as well. Trends show that PPI inflation pressures are elevated. And while the PPI is not the main focus of ECB policy, the pressure on prices is widespread across main EU countries. The bank of England has even recently said it was going to look beyond headline inflation as legacy issues might damp that calculation in the coming months. Central banks are becoming more concerned about embedded inflation pressures. |
|---|
| M/M | SAAR | ||||
| Euro area 13 | Feb-07 | Jan-07 | 3-Mo | 6-MO | Yr/Yr |
| Total (Excl Construction) | 0.3% | 0.2% | 2.1% | 0.2% | 2.9% |
|
yes"> Excl Energy | 0.3% | 0.5% | 3.4% | 2.7% | 3.4% |
| Capital Goods | 0.1% | 0.5% | 2.9% | 2.3% | 2.0% |
| Consumer Goods | 0.2% | 0.3% | 2.4% | 1.2% | 1.6% |
| Intermediate & Capital Goods | 0.3% | 0.6% | 3.9% | 3.4% | 4.4% |
| Energy | 0.4% | -0.7% | -1.8% | -7.5% | 1.0% |
| Manufacturing | 0.4% | 0.1% | 2.3% | -0.4% | 2.5% |
| Germany | 0.3% | 0.0% | 1.0% | 0.3% | 2.8% |
|
yes"> Excl Energy | 0.3% | 0.2% | 2.2% | 2.4% | 3.0% |
| France | 0.3% | 0.1% | 1.1% | -0.7% | 2.0% |
|
yes"> Excl Energy | 0.2% | 0.5% | 2.2% | 1.9% | 2.8% |
| Italy | 0.4% | 0.0% | 2.4% | 0.2% | 4.0% |
|
yes"> Excl Energy | 0.3% | 0.6% | 4.3% | 3.0% | 4.2% |
| UK | -0.8% | -1.4% | -6.7% | 1.4% | -1.4% |
|
yes"> Excl Energy | 0.4% | 0.5% | 3.7% | 3.1% | 3.4% |
| Euro area 13 Harmonized PPI excl Construction. | |||||
| The EA 13 countries are Austria, Belgium, Finland, France, Germany, Greece, Ireland, Italy, Luxembourg, the Netherlands, Portugal, Slovenia and Spain | |||||
| 6COLSPAN | |||||
by Robert Brusca April 3, 2007
Trend across categories and countries do not show a steadily accelerating inflation rate that central banks would clearly abhor. But they do show that pressures that had dissipated have re-emerged in the 3-month inflation rates. Excluding energy, inflation trends across the main countries show the same tendency except in Germany and in France where the pace of PPI ex-energy inflation is staying fairly constant, just above the 2% pace.
The headline inflation rate is moving steadily lower, but ex-energy inflation is considerably more stubborn around 3.5%, well above the ECB ceiling rate of 2% (for the HICP).
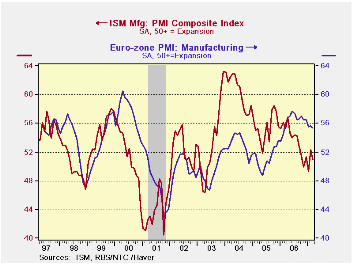
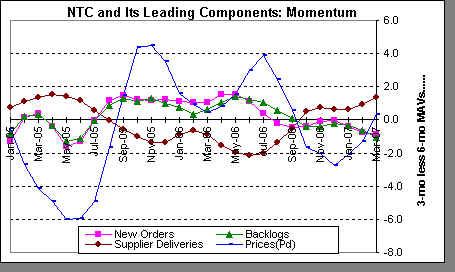 The leading components of the NTC E-zone index are showing mixed trends. We form these trends as the difference between the 3 month and six month indexes. Supplier deliveries and prices-paid are turning up while new orders and order backlog trends are eroding.
 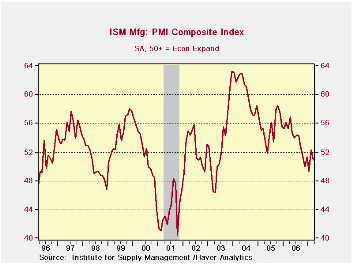 The chart on the left shows the ISM clearly has broken through the up trend from its recession recovery and now is in a well-established downtrend. Its recent up-tick is still in the grip of that down-trending range.
The table below shows the ISM and its components with a number of statistics that describe it/them.
The chart on the left shows the ISM clearly has broken through the up trend from its recession recovery and now is in a well-established downtrend. Its recent up-tick is still in the grip of that down-trending range.
The table below shows the ISM and its components with a number of statistics that describe it/them.