 Global| Apr 02 2007
ISM: Better But Not Out of the Woods
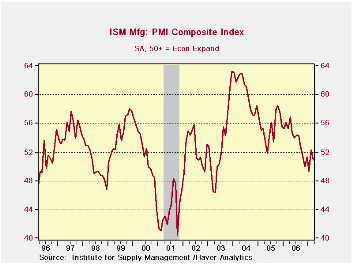 The chart on the left shows the ISM clearly has broken through the up trend from its recession recovery and now is in a well-established downtrend. Its recent up-tick is still in the grip of that down-trending range.
The table below shows the ISM and its components with a number of statistics that describe it/them. A quick perusal of the table shows why I like to evaluate the ISM by looking at the values in the LAST TWO columns instead of seeing if the index is above 50 (Rising) or below it (Falling).
Each of these ISM components has a different range variability characteristic, range of values and mean.
Even with the ISM above 50, as it is this month, it is still only in the 46th percentile of its range and at 96% of mean.
The chart on the left shows the ISM clearly has broken through the up trend from its recession recovery and now is in a well-established downtrend. Its recent up-tick is still in the grip of that down-trending range.
The table below shows the ISM and its components with a number of statistics that describe it/them. A quick perusal of the table shows why I like to evaluate the ISM by looking at the values in the LAST TWO columns instead of seeing if the index is above 50 (Rising) or below it (Falling).
Each of these ISM components has a different range variability characteristic, range of values and mean.
Even with the ISM above 50, as it is this month, it is still only in the 46th percentile of its range and at 96% of mean.Only inventories, prices and the trade-related components are above their mean values. Employment, at 99% of its mean, is nearly there.
So while the ISM indicates expansion in the lexicon of the ISM we can see it is indeed a still wounded report that shows manufacturing is not yet up to par.
| Since June 1998 | |||||||||
| ISM | Current | Std Dev | Average | SD%Avg | MAX | MIN | Range | Percentile | % of AVG |
| PM Index | 50.9 | 5.3 | 53.2 | 10.0 | 63.2 | 40.5 | 22.7 | 45.8 | 96 |
| New Orders | 51.6 | 6.7 | 55.8 | 12.0 | 71.3 | 38.4 | 32.9 | 40.1 | 93 |
| Backlogs | 47.0 | 6.7 | 50.4 | 13.4 | 66.5 | 36.0 | 30.5 | 36.1 | 93 |
| Production | 53.0 | 6.3 | 55.7 | 11.4 | 70.0 | 38.6 | 31.4 | 45.9 | 95 |
| Supplier Deliveries | 51.3 | 5.0 | 54.2 | 9.2 | 68.1 | 45.4 | 22.7 | 26.0 | 95 |
| Inventories | 47.5 | 3.9 | 45.8 | 8.6 | 53.6 | 37.1 | 16.5 | 63.0 | 104 |
| Prices (Pd) | 65.5 | 12.6 | 62.1 | 20.3 | 88.0 | 32.0 | 56.0 | 59.8 | 105 |
| Employment | 48.7 | 5.9 | 49.3 | 12.0 | 60.3 | 35.1 | 25.2 | 54.0 | 99 |
| New Export Orders | 55.5 | 3.5 | 53.6 | 6.6 | 60.2 | 44.3 | 15.9 | 70.4 | 104 |
| Import Orders | 57.5 | 3.6 | 54.6 | 6.6 | 61.5 | 46.9 | 14.6 | 72.6 | 105 |
| Avg Days Lead For: | Since June 1998 | ||||||||
| Production Material | 45.0 | 3.2 | 47.1 | 6.9 | 55.0 | 38.0 | 17.0 | 41.2 | 96 |
| Capital Expenditure | 110.0 | 8.7 | 107.1 | 8.1 | 120.0 | 86.0 | 34.0 | 70.6 | 103 |
| Maint., Repair, & Ops | 22.0 | 2.1 | 22.5 | 9.5 | 29.0 | 17.0 | 12.0 | 41.7 | 98 |
| Note: From April 1991 to Date; except back logs since Jan 1993 | |||||||||
by Robert Brusca April 2, 2007
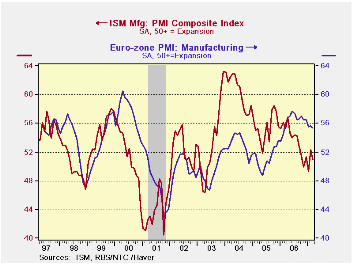 As you can tell from the chart on the left the sense of there being separate business cycles in the US and in Europe is a sort of joke. The US and Euro area manufacturing indexes are plotted on top of one another and their sense of co-variation is unmistakable. Also the US is shown to be the male and E-zone is the female; that is to say, if we regard this as a dance, the US leads.
 In the recent mini-cycle, Europe has struck out a bit on its own. A US up-cycle from mid-2005 aborted early, turning to decline. Meanwhile, Europe has continued to expand and only recently has hit a plateau with hint of erosion. In the US, the down-cycle is only showing early signs of stabilization. We wonder if Europe needs the US more than the US needs Europe?
The table above shows hath the E-zone readings, while off peak, are still very high in the range they have occupied since Mid-1997. The overall index is in the top 30% of its range and stands 6% above its average. Orders are similarly strong. Supplier deliveries are showing the weakest relative performance 10% below their average of the period.
| Since June'98 | |||||||||
| NTC E-zone | Current | Std Dev | Average | SD% Avg | MAX | MIN | Range | Percentile | % of AVG |
| NTC Index | 55.4 | 3.8 | 52.5 | 7.3 | 60.5 | 42.9 | 17.5 | 71.1 | 106 |
| New Orders | 56.4 | 4.6 | 53.5 | 8.7 | 62.4 | 41.0 | 21.4 | 72.3 | 105 |
| Backlogs | 53.9 | 3.1 | 52.0 | 5.9 | 57.6 | 47.2 | 10.5 | 64.1 | 104 |
| Production | 57.4 | 4.2 | 54.2 | 7.7 | 62.8 | 43.0 | 19.9 | 72.8 | 106 |
| Supplier Deliveries | 42.5 | 4.8 | 47.2 | 10.1 | 56.9 | 34.7 | 22.2 | 35.1 | 90 |
| Inventories | 48.7 | 1.0 | 48.3 | 2.0 | 50.4 | 46.2 | 4.3 | 58.9 | 101 |
| Prices (Pd) | 66.1 | 9.8 | 59.7 | 16.4 | 76.5 | 37.7 | 38.8 | 73.3 | 111 |
| Employment | 52.9 | 2.9 | 49.8 | 5.8 | 56.0 | 44.2 | 11.8 | 73.9 | 106 |
| New Export Orders | 55.3 | 4.3 | 52.8 | 8.1 | 60.0 | 39.4 | 20.6 | 77.5 | 105 |
| Note: From June 1997 to Date; except back logs since Nov '02 | |||||||||
by Louise Curley April 2, 2007
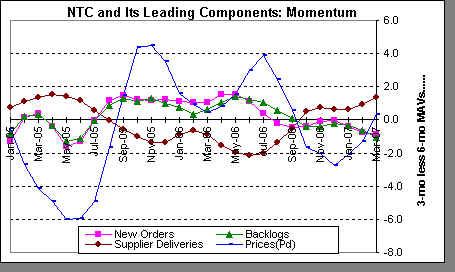 The leading components of the NTC E-zone index are showing mixed trends. We form these trends as the difference between the 3 month and six month indexes. Supplier deliveries and prices-paid are turning up while new orders and order backlog trends are eroding.
On balance, we can see the strong US-Europe linkages or commonalities. The history looks as though the US cycle gets transmitted to Europe, but Europe is recently showing some independent strength. However, it is also showing some sign of decay. It hardly seems as though a further rise in the Euro can do any good for Europe. But, so far so good.
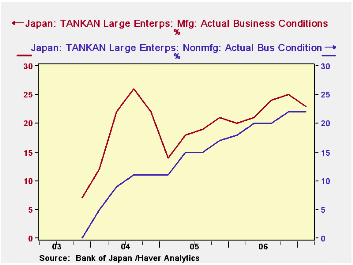
Japan's Tankan released today showed that the headline large manufacturers' business condition DI (Diffusion Index) declined to 23% in March from 25% in December. These same firms forecast that the DI would decline further in June to 20%. The DI for non manufacturing large firms, on the contrary, remained steady in March at 22% and forecast that it would rise to 22% in June. The first two charts compare the actual results and forecasts for large manufacturing and non manufacturing firms.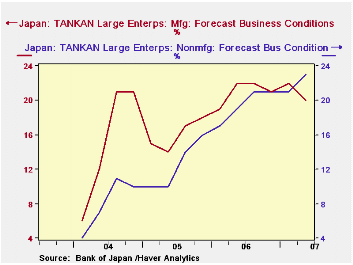
As noted in the JAPAN data base, major revisions in the Tankan survey have created a discontinuity in the series beginning with the first quarter of 2004. The old series is maintained by Haver as a DISCONTINUED series. While the two series are not comparable, the old series is useful in that it provides some perspective in which we can judge the recent data. We have plotted the actual conditions of large manufacturing firms in the new and the DISCONTINUED series. While the recent data are less robust than those of the nineties, they are significantly above those of the decade or so of sub par Japanese economic activity, as shown in the third chart.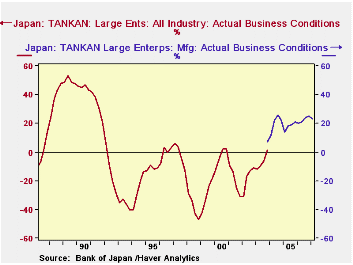
Fixed investment expenditures by large manufacturing firms are forecast to increase more slowly, from 2.8% to 2.5%, in the current fiscal year; those by the large non manufacturing firms are set to increase 3.1% from 1.6% last year. The fourth chart shows in forecasted increases in fixed investment by large firms.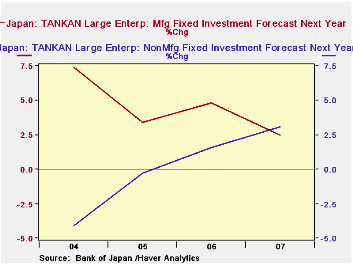
| JAPANESE TANKAN | Q2 06 | Q1 06 | Q4 05 | Q3 05 | Q2 05 | Q1 05 |
|---|---|---|---|---|---|---|
| Business Conditions Forecasts Large Firms (Percent Balance) | ||||||
| Manufacturing | 20 | 22 | 21 | 22 | 22 | 19 |
| Non Manufacturing | 23 | 21 | 21 | 21 | 19 | 17 |
| Business Conditions Actual Large Firms Percent Balance | ||||||
| Manufacturing | -- | 23 | 25 | 24 | 21 | 20 |
| Non Manufacturing | -- | 22 | 22 | 20 | 20 | 18 |
| Fixed Investment Expenditures % Change |
2007 | 2006 | 2005 | 2004 | ||
| Manufacturing | 4.4 | 3.4 | 4.8 | 2.5 | -- | -- |
| NonManufacturing | -4.1 | -0.3 | 1.6 | 3.1 | -- | -- |

Robert Brusca
AuthorMore in Author Profile »Robert A. Brusca is Chief Economist of Fact and Opinion Economics, a consulting firm he founded in Manhattan. He has been an economist on Wall Street for over 25 years. He has visited central banking and large institutional clients in over 30 countries in his career as an economist. Mr. Brusca was a Divisional Research Chief at the Federal Reserve Bank of NY (Chief of the International Financial markets Division), a Fed Watcher at Irving Trust and Chief Economist at Nikko Securities International. He is widely quoted and appears in various media. Mr. Brusca holds an MA and Ph.D. in economics from Michigan State University and a BA in Economics from the University of Michigan. His research pursues his strong interests in non aligned policy economics as well as international economics. FAO Economics’ research targets investors to assist them in making better investment decisions in stocks, bonds and in a variety of international assets. The company does not manage money and has no conflicts in giving economic advice.
More Economy in Brief


