Haver Analytics
Haver Analytics

Economy in Brief: August 2025

  • Global| Aug 14 2025

    EMU IP Set-back in June

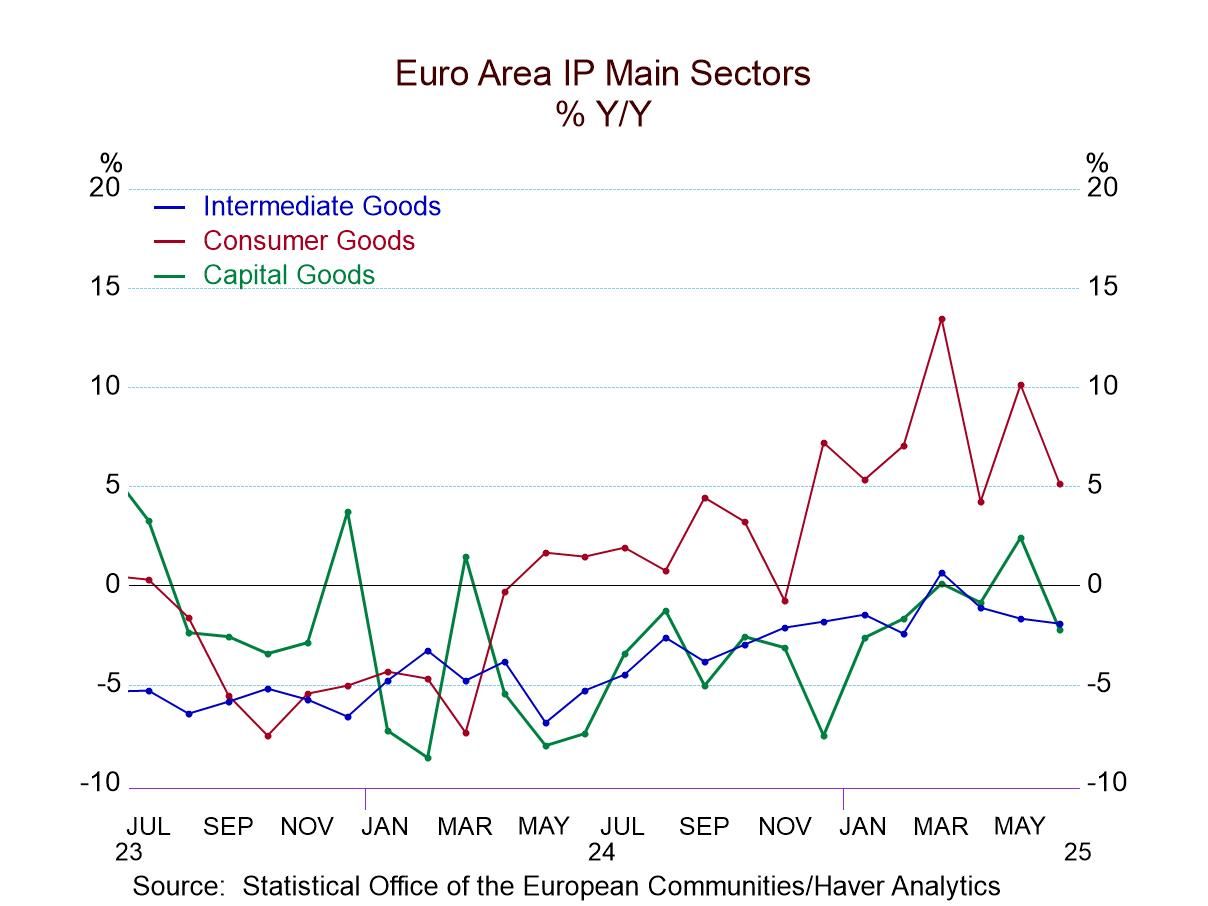
    Consumer goods output in the European Monetary Union has been expanding since the second quarter of 2024; however, that has not been enough to bring expansion to output overall. Intermediate and capital goods output continue to be under duress. In June, overall IP output fell by 1.3%, manufacturing output fell by 1.6%, and the consumer goods sector, which has been the core of strength for output, declined on the month by 4.3%. Capital goods output fell 2.2% and the output of intermediate goods fell by 0.2%. All in all, it was a tough June for the industrial sector in the European Monetary Union.

    Sequential growth rates Industrial output excluding construction gained 0.5% over 12 months, rose over six months at a 2.5% annual rate, and then experienced a sharp decline over three months as output fell at a 10.3% annual rate. Consumer goods output gained 5.1% over 12 months but declined at a 1.8% annual rate over six months and fell at an 8.6% pace over three months; both consumer durables and nondurable goods output are sharply lower over three months. Intermediate goods output fell by 1.9% over 12 months; it's flat over six months and then dropped at a 10.7% annual rate over three months. Capital goods output fell 2.2% over 12 months, gained 0.4% at an annual rate over six months, then fell sharply at a 9.7% pace over three months. To some extent, this is a tariff-related trend as firms in Europe had cranked-up output to get goods out ahead of the tariffs and now that we are in the actual tariff period output is being cut back to trend and to account for the previous surge. So, the reductions in output appear a little more draconian than the actual weakness in the economy - these are still trends to watch, however.

    Ranking trends for growth Ranking 12-month growth rates show us a great deal of weakness in the growth of manufacturing output. The headline for output excluding construction has a 51.4 percentile standing on data back to late 2007. This means over this period, the pace of the output gains is slightly ahead of its median. The median for ranked data occurs at a ranking of 50%. Consumer goods output has an 88.3 percentile ranking for its growth rate that is created entirely by a 90.7 percentile growth rate ranking for consumer nondurable goods, since consumer durable goods have only a 20.6 percentile ranking. Intermediate goods’ growth rate has a 37.4 percentile ranking and capital goods have a 24.8 percentile ranking. The annual rates of output growth are weak except for nondurables in the consumer sector. For manufacturing overall, the ranking is in the 41.6 percentile, below its median.

    Output trends since COVID Not surprisingly, if we look at output gains compared to January 2020 before COVID struck, only total consumer goods output and consumer goods output of nondurables have levels of output that are greater than what they created in January 2020. Overall output, however, is close to maintaining its performance from five years ago with current output at 98.5% of what it was in January 2020; manufacturing output is at 98.8% of what it was in January 2020 as well. The most lagging component is intermediate goods where output is only 88.4% of what it was in January 2020. All of the components are weak because they show output has not grown in over five years – except for consumer nondurables-all the other ratios are below 100%.

    Country performance Among the 13 European Monetary Union members in the table for June, 6 of them show output declines in that month. That's an improvement from nine that declined in May and seven that showed declines in April. Despite the fact that overall output growth fell in June, the unweighted average across these reporting countries shows a median increase in output of 0.5% in June, up from -0.7% in May and -0.2% in April. The pooled country level statistics are not weighted for manufacturing or GDP importance. Germany continues to be one of the main reasons for economic weakness in the monetary union. Only Germany and Luxembourg show the declines on all three horizons of 12 months, 6 months, and 3 months.

    Quarter-to-date The second quarter to date column which now is for the completed quarter shows the overall output and manufacturing output are declining on the quarter and in five reporting countries: Austria, Germany, the Netherlands, Malta, and Ireland.

    Output growth by country The ranking of output growth shows rankings across these 13 countries that are above their median and data back to 2007 for all but four countries. However, one of those four lagging countries is Germany, and Germany's rank on the period is only in its 14th percentile – exceptionally weak. Germany, which has the largest manufacturing sector and is generally the powerhouse of Europe, is the main reason that the aggregate industrial production data for the EMU are so weak. Manufacturing in most of the rest of the monetary union is performing at a level better than its historic median; back to late 2007, there are only four exceptions, and Germany is the main one.

    • Loan refinancing continues to strengthen as purchase applications rise slightly.
    • Effective fixed-interest rate on 30-year loans falls to four-month low.
    • Average loan size continues to increase.
  • In what is becoming a more common global story, confidence in Norway is rebounding after an earlier significant setback as countries recalibrate their circumstances under the revised Trump's tariff format. Norwegian consumer confidence had slipped in the second quarter to -19.1 from -5.4 in the first quarter, but now in the third quarter, confidence is snapping back to a -3.2 reading, the strongest reading since the first quarter of 2022.

    Of course, there's a lot in the mix for this important northern European economy. Norway is an oil economy, and it also is one of the economies that is more vulnerable to relations with Russia. It has a relatively short but direct common border with Russia in the far north; otherwise, the borders are with Sweden and Finland. Still, with conditions in Russia touch and go and with Russian aircraft occasionally testing the air defenses the Baltic region, this is a geopolitically sensitive location.

    On the economic front, inflation has been creeping up but the headline and core inflation rates are above the 2% mark and largely occupying space between 2.5% and 3%. Economic performance has been a bit uneven with the unemployment rate beginning to move up, as that rate has been notching steadily higher as 2025 has progressed. The last move by the central bank was to cut its key interest rate on site deposits. With the unemployment rate rising, there was little reaction in the bond market to this, especially in the environment where the manufacturing sector continues to be under pressure as it is for the most part globally with output in Norway contracting over the past two months (Y/Y).

    Consumers’ rating of the environment for spending improved in the third quarter after deteriorating sharply in Q2. Its improvement brings it to a level above where it was in the first quarter as well; however, on ranked data back to the early 1990s the environment for making a major purchase still only has an 11.4 percentile standing, a relatively weak performance.

    The assessment of the overall economy for the next year improved sharply once again after falling sharply in the second quarter. This metric had a value of 5.1 in the first quarter that slipped back to -21.2 in the second quarter; since then, the third quarter has gained some of that back at a survey reading of -3.3. It's still not back to its first quarter level, and it still is a reading that represents relatively weak performance as it has a 28.8 percentile standing which leaves it clearly in the bottom third of its queue of values since the early 1990s.

    However, the personal finance readings do pick up for conditions expected for next year as the index evolves from a reading of 21.5 in the first quarter to 11.2 in the second quarter and back up to 21.8 in the third quarter of 2025. This reading brings the personal finance assessment to a 47-percentile standing, just slightly below its median for the period; at a level of 21.8, it's above its mean value of 20.1 for the period. This news on the personal finance front is better than anywhere else in the survey.

    Consumer confidence is also rated according to age. And while there are some differences among the age-cohorts, for the most part they move and evaluated in unison. The queue rankings range from 16.7% (with the youngest growth at the low end) to 25.8% with the oldest group at the high end. Over 4 quarters, the changes in the age-cohort evaluations range from +11.1 to +18.7.

    • Decline in energy & stable food prices reduce overall strength.
    • Core inflation picks up with tariff effects.
    • Core goods prices strengthen but core services inflation steadies.
    • July NFIB Small Business Optimism Index up 1.7 pts. to 100.3.
    • Uncertainty Index up 8 pts. to a 5-month-high 97.
    • Expectations for economy up 14 pts. to 36%, the highest since Feb.
    • Plans to expand business up 5 pts. to 16%, the highest since Jan.
    • Expected real sales down 1 pt. to 6%, still positive for the third straight month.
    • Percent of firms raising avg. selling prices down 5 pts. to a 6-month-low 24%.
    • Quality of labor (21%), taxes (17%), and inflation (11%) are the top three business concerns.
    • Gasoline prices weaken.
    • Crude oil prices decline sharply.
    • Natural gas prices ease.
  • Macro-expectations- The ZEW financial experts registered disappointment this month in the tariff deal that the European Community struck with the United States. Macroeconomic expectations in August for Germany were slashed back to a reading of 34.7 in August from 52.7 in July; for the United States, expectations also were cut to -41.2 from -34.2. These two sets of reductions brought German expectations to a 60.8 percentile standing, leaving them still above their median on data back to the early 1990s. The U.S. reading has a much lower, 9.3 percentile standing on the same timeline. Despite the ZEW experts’ opinion that the tariff deal is bad for Europe, it apparently doesn't boost expectations for the U.S. at all. This, of course, makes me wonder to what extent the forecast has a bit of sour grapes to it.

    The economic situation- The economic situation also deteriorates this month with the euro area assessment falling to -31.2 from -24.2 in July. Germany's assessment falls to -68.6 from -59.5 as the tariff deal weighs on Europe and Germany. The current situation for the U.S. improves marginally to +0.1 in August from -5.9 in July. These new readings leave the euro area economic situation reading with a ranking in its 46.9 percentile, Germany ranks in its 22.2 percentile, and the U.S. stands in its 35.1 percentile.

    Inflation expectations- Inflation expectations in Europe remain low but increased to some extent in the U.S. where they were already high. The European readings for the euro area fell back to -6.7 in August from -5.8 in July. For Germany, the reading was little changed at -5.1 in August from -5.2 in July. The U,S, rating moved up to +74.5 in August from +64.3 in July. The queue standings for these metrics show the euro area inflation expectations standing in its 27th percentile, the same as for Germany, but for the United States inflation expectations are up to their 95.9 percentile! This is an extremely interesting angle from the ZEW financial experts because we have the Fed in the U.S. poised to cut interest rates. We have the President pushing the Fed to cut interest rates more quickly and more deeply than it wants to do it. And despite the fact that inflation has run over target for four and a quarter years in the U.S., we have the Fed seemingly ready to cut interest rates, perhaps twice by the end of the year, even with the potential for inflation from tariffs knocking at the door. The ZEW experts ‘take’ on the U.S. and its financial situation seems to be quite different from how it's being analyzed in the United States.

    Short-term interest rates- Short-term interest rate expectations for the euro area show less of an inclination for rates to fall with the -35.7 reading in August compared to -49.7 in July. For the U.S., the -61.5 reading is lower than July's -43.8, indicating that expectations for rate cuts in the U.S. are growing. The euro area short-term rate expectation has an 18.4 percentile standing whereas in the U.S. the standing is at its 10.4 percentile.

    Long-term rate expectations- Long-term interest rates found reductions both in Germany and the U.S. in August. German expectations fell to an index reading of 19.0 from 26.1 in July. In the U.S., the reading fell to 26.4 from 38.7. The queue standings for the German rate are in their 25.5 percentile, below the U.S. where the percentile standing is at its 32nd percentile. In both cases, the expectations for long rates indicate a good deal of moderation. Queue standings well below their respective median readings for both Germany and the U.S. (remembering that the medians for ranked data occur at the 50th percentile mark).

    Stocks- Stock market expectations were slightly weaker in Europe with the euro area falling to 18.1 in August from 22.4 in July. The German reading fell back to 18.5 from 24.6, while the U.S. reading is little changed at 8.4 compared to 8.6 in July. The standings for all of these readings are around the 15th percentile; there are small differences among the different reporters, but nothing of significance.

    • Decline is first in three months.
    • Crude oil and metals prices move lower.
    • Lumber prices improve while textile costs steady.