- Purchase applications decline while loan refinancing increases.
- Effective interest rates reverse prior week’s increase.
- Average loan size declines.
 USA| Jul 19 2023
U.S. Mortgage Applications Increase as Interest Rates Decline
by:Tom Moeller
|in:Economy in Brief
 USA| Jul 18 2023
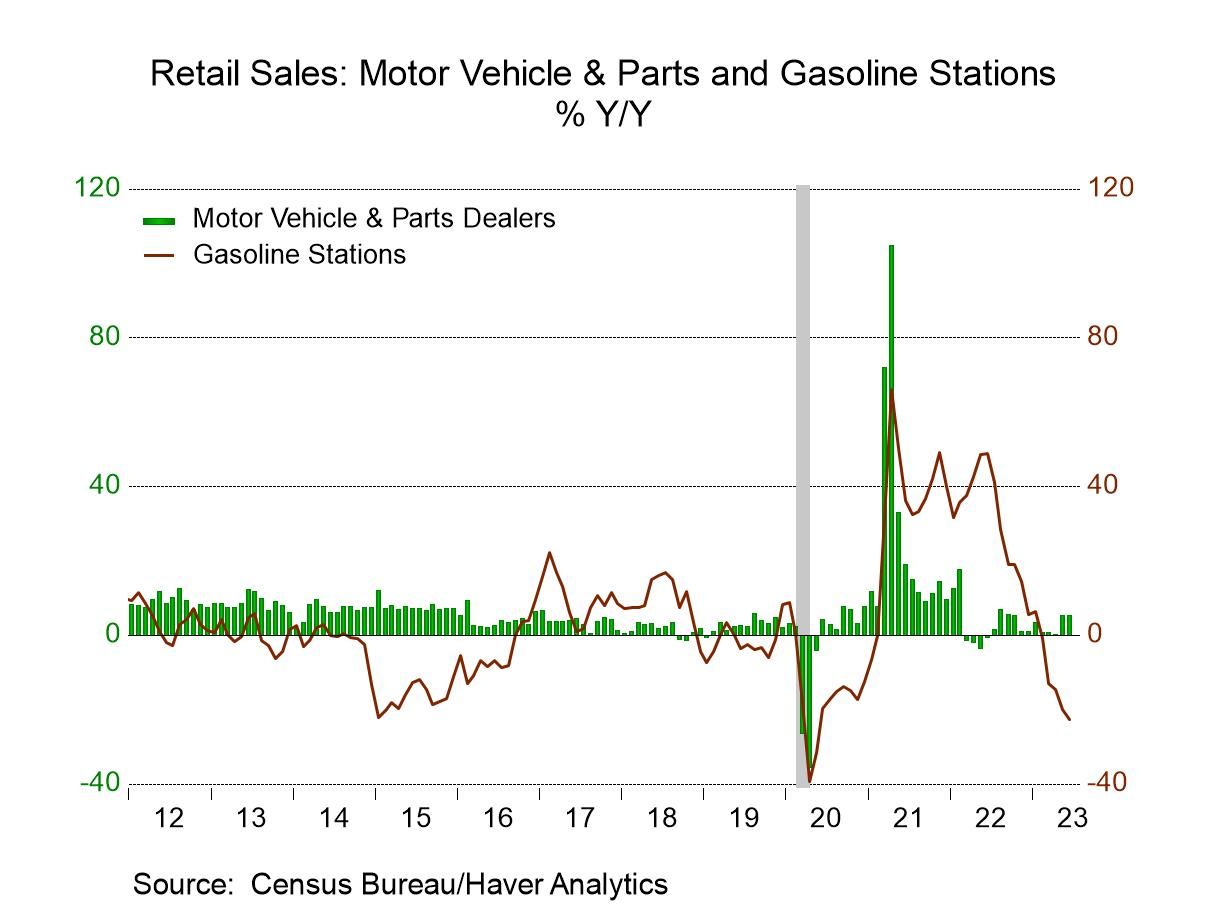
U.S. Retail Sales Gain Eases in June
- Gasoline & building material sales decline.
- Sale of core goods strengthen.
- Online retail sales surge.
by:Tom Moeller
|in:Economy in Brief

- IP -0.5% in June; May revised down but April revised up.
- Mfg. IP declines 0.3%, w/ durable goods down 0.1% and nondurable goods down 0.6%.
- Utilities output decreases for the fifth time in six months.
- Mining activity and consumer goods output down for the second successive month.
- Capacity utilization falls 0.5%-pt. to a six-month-low 78.9%; mfg. capacity utilization falls 0.3%-pt. to a three-month-low 78.0%.
 USA| Jul 18 2023
U.S. Home Builders Index Increases in July
- Activity increases in each month this year.
- Buyer traffic continues to rise.
- Regional performance remains mixed.
by:Tom Moeller
|in:Economy in Brief
 USA| Jul 18 2023
U.S. Business Sales and Inventories Rose in May
- Factory inventories up 0.2% so far in Q2, reversing 0.2% decline in Q1.
- Factory and retail sales up in May while wholesale sales fell for third consecutive month.
- Total I/S ratio unchanged but remained highest since June 2020.
by:Sandy Batten
|in:Economy in Brief
 USA| Jul 18 2023
U.S. Gasoline & Oil Prices Improve
- Gasoline prices rise again.
- Crude oil prices rise to highest level since April.
- Natural gas prices steady.
by:Tom Moeller
|in:Economy in Brief
 Japan| Jul 18 2023
METI Indexes Show a Mixed May; Industry Weaker; Services Stronger
The just-released METI sector indexes for May show that the industry index has stepped down to 103.2 from 105.5 in April. The tertiary index, an indicator for the services sector, moved up to 102.0 from 100.8.
More on METI The graph shows that year-on-year growth for both sectors is positive, which is a good sign. The growth rate for the industry index is at its 78th percentile while the growth rate for services is at its 90th percentile. Both indexes log growth rates rankings over the past year that are solid and positive in comparison with their own histories.
However, in terms of levels, the industry index is extremely weak, at a 9.4-percentile standing. The level of industrial activity in May is in the lower 10-percentile of activity among all months since 1990. That is impressively disappointing. Comparing the services level historically we obtain a solid reading, at its 81st percentile. Of course, over time these indexes should grow; even an 81-percentile standing is not particularly strong. However, for industry having an index level that says weak as 9.4% on data since 2009, the ranking tells us that industry in Japan has been lagging recently, since it is a real activity index, not a diffusion index.
The table also looks at the growth in the industry and tertiary sectors from January 2020 just before COVID struck the worldwide economy. On that basis, the industry index is lower by 5.1% and the services sector is higher by only 0.4%, the former very weak, the latter, a small gain over such a long period of time.
Other Metrics The Economy Watchers Index In addition to the METI indexes, the table offers the economy watchers readings (a diffusion index). In May, the economy watchers index moved up to 55 from 54.6 in April; the growth rate of the index has a 55.2 percentile standing. However, the economy watchers index level was at 95.3%. So, the index level was solid/strong, but its growth rate over the last year is weaker than for the METI indexes. The economy watchers indicator for the service sector in May ticked up to 59.2 from 59.1; it has only a 47.6 percentile standing on growth, which puts it below its median growth rate since 1990 although for the service sector the index level has a 97.7 percentile standing. Strictly speaking, the standings of an index like METI, versus a diffusion index, like the economy watchers, are not directly comparable- one measures breadth, the other activity in absolute terms. The economy watchers index for employment overall moved up to 57.1 in May from 55.8 in April. The ranking of the growth rate is below its median at a 47.6 percentile standing and the standing of the index level, at its 76-percentile, a relatively a moderately firm standing for an index level on diffusion. The economy watchers survey also has a future gauge; in May, it slipped to 54.4 from 55.7; the growth of the future gauge sits in its 65.7 percentile, above its historic median. The index level for the future index is also relatively high at a 93-percentile standing. All the various components of the economy watchers index are higher compared to January 2020.
The Teikoku Index The Teikoku index is another diffusion index that looks at various sectors. Teikoku in May shows a slight improvement for manufacturing at a 41.5 diffusion reading; still with a diffusion value below 50 indicating contraction, but ever-so-slightly less contraction than a month ago as the reading ticked up from 41.4 in April. The growth ranking for the index is at its 53.1 percentile, modestly above its historic median. With the index level at a 57.6 percentile standing, the assessment is not particularly impressive. For services in May, the Teikoku index moves up to 51.6 from 50.8; the growth rate of services over the past year has a 79-percentile standing, a relatively solid standing with an index level standing at 87.2%. The Teikoku indices show all the components somewhat higher compared to their respective levels of January 2020, apart from construction that's lower on balance from its January level by 3.1 points.
Leading Economic Index The final metric in the table is the leading economic index. As of May, that index moved up to 109.5 from April’s 108.1. The growth rate for the leading index has a ranking at the 41.9 percentile which puts it below its historic median growth rate. The index level for the LEI is a weak 35-percentile standing, another relatively weak response based on the level of an activity index. However, leading index is higher by 7.7% from its level in January 2020, before the COVID virus struck the world economy; that’s something.
 USA| Jul 17 2023
Empire State Factory Index Declines in July
- Index reverses some of June rebound.
- Component movement is mixed.
- Price indexes fall sharply.
- Expectations ease.
by:Tom Moeller
|in:Economy in Brief
- of10Go to 5 page