- LEI shows consecutive m/m decreases since April 2022.
- Coincident Economic Index up for the fifth time in six months.
- Lagging Economic Index up for the second successive month.

 USA| Oct 19 2023
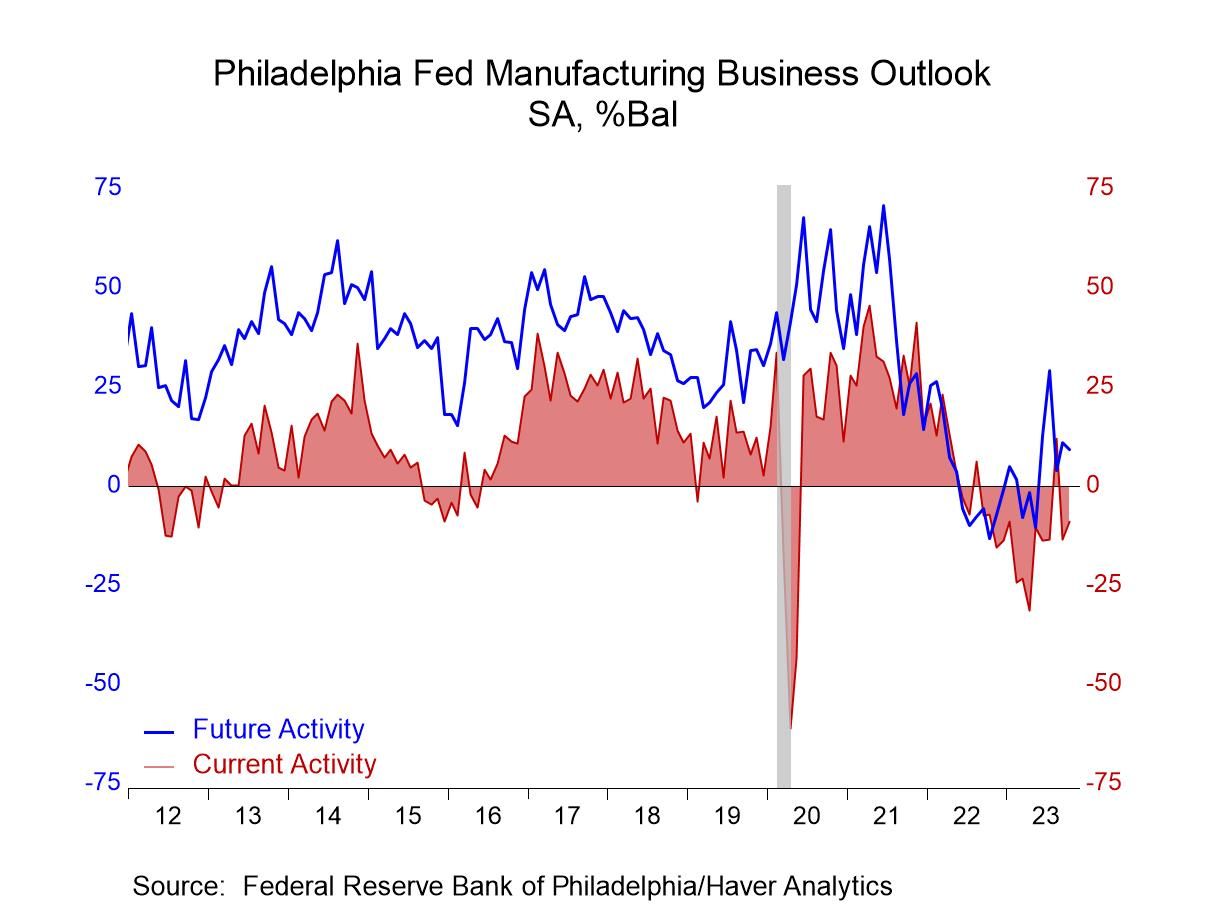
Philadelphia Fed Manufacturing Index Remains Negative in October
- Composite index is negative but orders, shipments & employment improve. Order backlogs & delivery times readings decline.
- Prices paid reading eases; prices received is little changed.
- Expectations backpedal a bit.
by:Tom Moeller
|in:Economy in Brief
 USA| Oct 19 2023
Initial Unemployment Claims Fell—Lowest Since January
- Claims unexpectedly fell to 198,000 in the week ended October 14.
- This is the lowest weekly level since January 21.
- Continuing claims edged up to their highest level since July 8, but remain low historically.
by:Sandy Batten
|in:Economy in Brief
 France| Oct 19 2023
France’s INSEE Survey Shows Weaker Manufacturing and Services
The INSEE industry climate gauge as a 29.6 percentile standing and the index fell month-to-month to boot. The index is still below (by 3.6 points) its level of January 2020 before the pandemic struck.
The INSEE manufacturing survey The manufacturing production outlook fell back to -10.3 in October from -6.1 in September, only slightly weaker than the August reading of -9.0. These expectations have been weaker since 2001 about 31% of the time and stronger nearly 70% of the time.
Production has a ‘recent trend’ that has worsened in the month as it fell to a diffusion value of -11.3 in October from -6.4 in September and -4.0 in August. This trend has been weaker historically by less than 10% of the time. Survey respondent also supply expectations for their own firm/industry as a ‘personal likely trend.’ This assessment fell to 4.8 in October from 16.6 in September – but it is higher in comparison to August. The reading for the own-firm trend is at a 29.1% standing, much better than for manufacturing overall but still a lower one-third of ranking value.
Orders and demand remained sub-par in October but improved to -17.3 from -21.5 in September and similar weakness in August. This entry has a percentile standing below its historic median at its 44.1 percentile. Foreign orders and demand have shown more persistent progress, rising to -2.9 in October from -13.0 in September; this series, quite contrarily, has a very strong 81-percentile standing. The French, in some sense, expect to be boosted by foreign economies. That remains to be seen since it is far from clear where this stronger growth is going to occur.
On the price front, the own-price responses are weaker than their August levels while for overall manufacturing prices, the expectation is for net stronger pressures. The own price ranking is at 34.8% with the manufacturing index at a 44.9 percentile.

- Rise in single-family starts is moderate.
- Increase fails to include Northeast.
- Single-family permits rise again, but multi-family permits decline.
by:Tom Moeller
|in:Economy in Brief
 USA| Oct 18 2023
U.S. Mortgage Applications Decline; Interest Rates Remain High
- Total applications weaken sharply to lowest level since 1995.
- Applications for purchase loans & refinancing decline.
- Mortgage interest rates remain at highest level since 2000.
by:Tom Moeller
|in:Economy in Brief
 United Kingdom| Oct 18 2023
U.K. Inflation Ticks Higher in September -RELAX
Inflation in the United Kingdom moved higher in September with the month-on-month CPIH headline rising by 0.5% after rising by 0.4% in August and falling by 0.1% in July. The core CPI, which is a measure excluding energy, food, alcohol beverages, and tobacco, rose by 0.4% in September after being flat in August and logging a 0.5% gain in July. The monthly trends of these inflation metrics are not particularly impressive; however, longer trends are more reassuring.
Headline inflation rises by 6.4% over 12 months, at a 4.4% pace over six months and at a 3.4% annual rate over three months. For the core CPI, the 12-month gain is 5.9%, moving higher to 6% over six months and then decelerating to 3.6% at an annual rate over three months. The 5.9% increase in the core-CPIH year-over-year is the same as it was in August. This pair of monthly observations shows the slowest increase in year-over-year inflation since March of this year. Similarly, the headline has become more disciplined even as the year/year pace rose to 6.4% from 6.3% in August. But this is the same as the 6.4% in July and prior to that inflation was running at a pace of greater than 7%, greater than 8%, and greater than 9%! Apart from this recent monthly stretch, inflation was last below 7% in March 2022. Even with the slight backtracking in the headline rate and the flat year/year result in the core, the trends for inflation progress in the U.K. remain in place.
Diffusion that looks at the propensity of inflation to pick up on a period-to-period basis shows mild readings for month-to-month data from July through September. September diffusion is at 54.5%, it was as low as 36.4% in August, and it was at 54.5% in July as well. The neutral reading for inflation is 50%. And the reading of 50% inflation is accelerating in as many categories as is decelerating period-to-period. A reading slightly above 50% indicates a slight tendency for inflation to accelerate across categories. These diffusion results are broadly in the zone of neutrality; in the case of August, there is a clear signal that inflation decelerated broadly.
Applied to the sequential data where we look at three-month inflation compared to six-month inflation, and six-month inflation compared to 12-month inflation, and 12-month inflation compared to a-year-ago inflation, we find diffusion measures at 36.4% over three months, at 45.5% over six months, and at 36.4% over 12 months. All of which indicate that inflation is slowing down period-to-period across categories. This means that inflation across the various CPI categories is behaving and giving the same signals as headline inflation, which is not always the case. In this case, the confluence of inflation trends, assessed in different ways, is reassuring.
 USA| Oct 17 2023
U.S. Retail Sales Firm in September
- Sales of core goods pick up.
- Online buying strengthens.
- Gasoline sales rise with higher prices.
by:Tom Moeller
|in:Economy in Brief
- of10Go to 5 page