 Asia
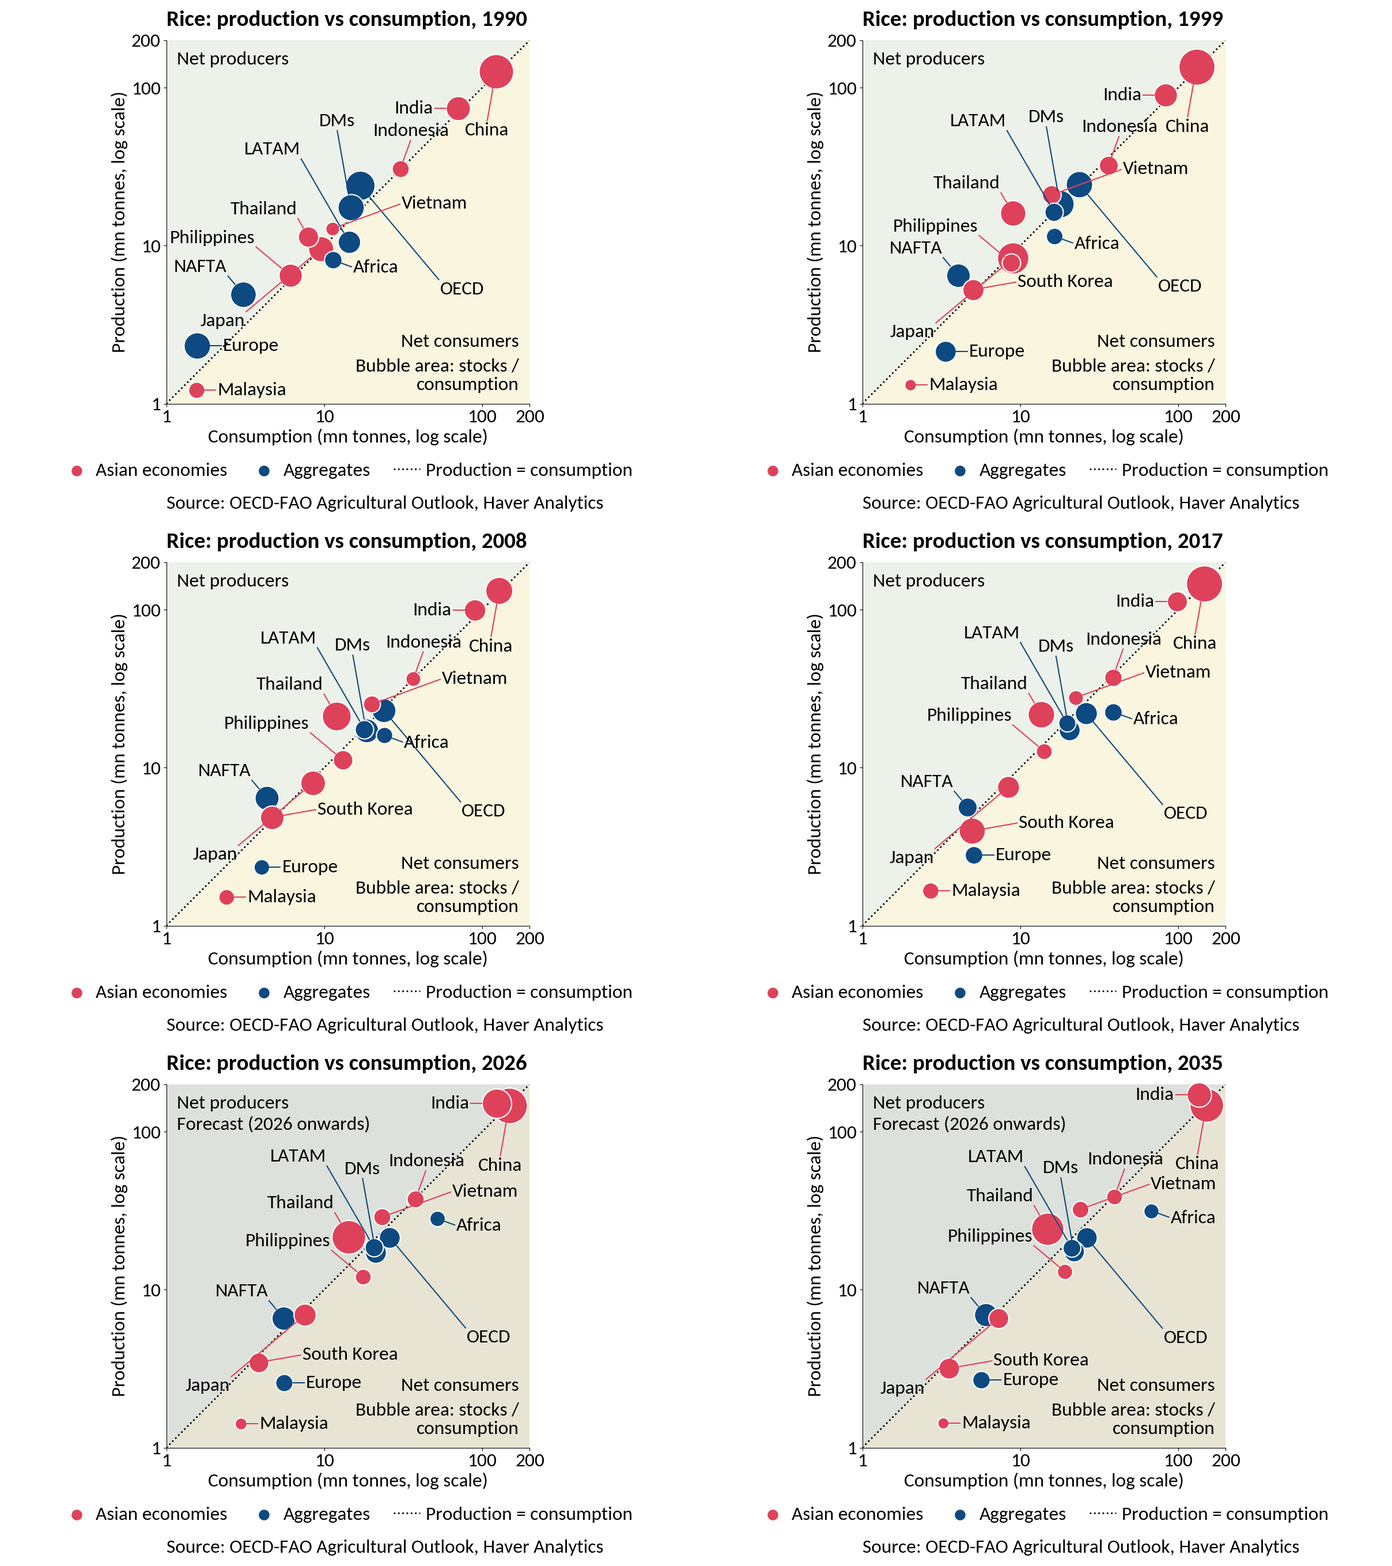
In this week's Letter, we examine how a strengthening El Niño is adding a food and weather shock to an Asia already absorbing an oil shock. El Niño is now in full swing, with the Southern Oscillation Index at its lowest in over two decades, and its fullest effects may only arrive next year (chart 1). Food prices are already turning up, and food price levels have risen most in India, the Philippines, Vietnam and Indonesia (chart 2). That adds a second source of inflation on top of the oil price surge that followed the disruption of shipping through the Strait of Hormuz. On the supply side, drought is hurting rice producers just as fuel and fertiliser costs climb, raising the risk of a significant negative supply shock. The most exposed are net rice consumers with thin stocks, such as the Philippines (chart 3). India shows how quickly conditions can deteriorate: its monsoon ended with its largest deficit since 2015, and reservoir storage has slipped below normal (chart 4). The effects reach beyond food. Drier conditions have fed peat and forest fires in Indonesia, pushing Singapore's air quality into the unhealthy range for the first time since 2023 (chart 5). For policymakers, El Niño adds food security, water security and inflation management to a list already crowded by the energy shock and geopolitics. The most agriculture-reliant economies, India, Indonesia and Vietnam, face a double hit to growth and prices (chart 6). Should food inflation force central banks to tighten further, the growth cost would rise again.
El Niño and food prices El Niño is now in full swing. The Southern Oscillation Index has plunged to around -2.7 on a three-month average basis, its lowest reading in over two decades and below even the 2015 trough (chart 1). Ocean temperatures tell the same story. The Niño 3.4 index, the main gauge of El Niño, tracks sea surface temperature anomalies in the central and eastern equatorial Pacific. A sustained reading of +0.5°C or more signals El Niño conditions, while readings above +1.5°C mark a strong event. The index reached +1.8°C in August, and the event is expected to persist into 2027. Its fullest effects may therefore only emerge next year, as weather damage to harvests feeds through to food supply with a lag. Food prices are already moving. Growth in the FAO Food Price Index has turned up to around 6% y/y, partly reflecting El Niño weather effects on crops. With food carrying a heavy weight in consumer baskets across emerging Asia, a sustained rise in global food prices would quickly find its way into regional inflation.