Global| Oct 01 2026
Charts of the Week: A Benign Phase
by:Andrew Cates
|in:Economy in Brief
Summary
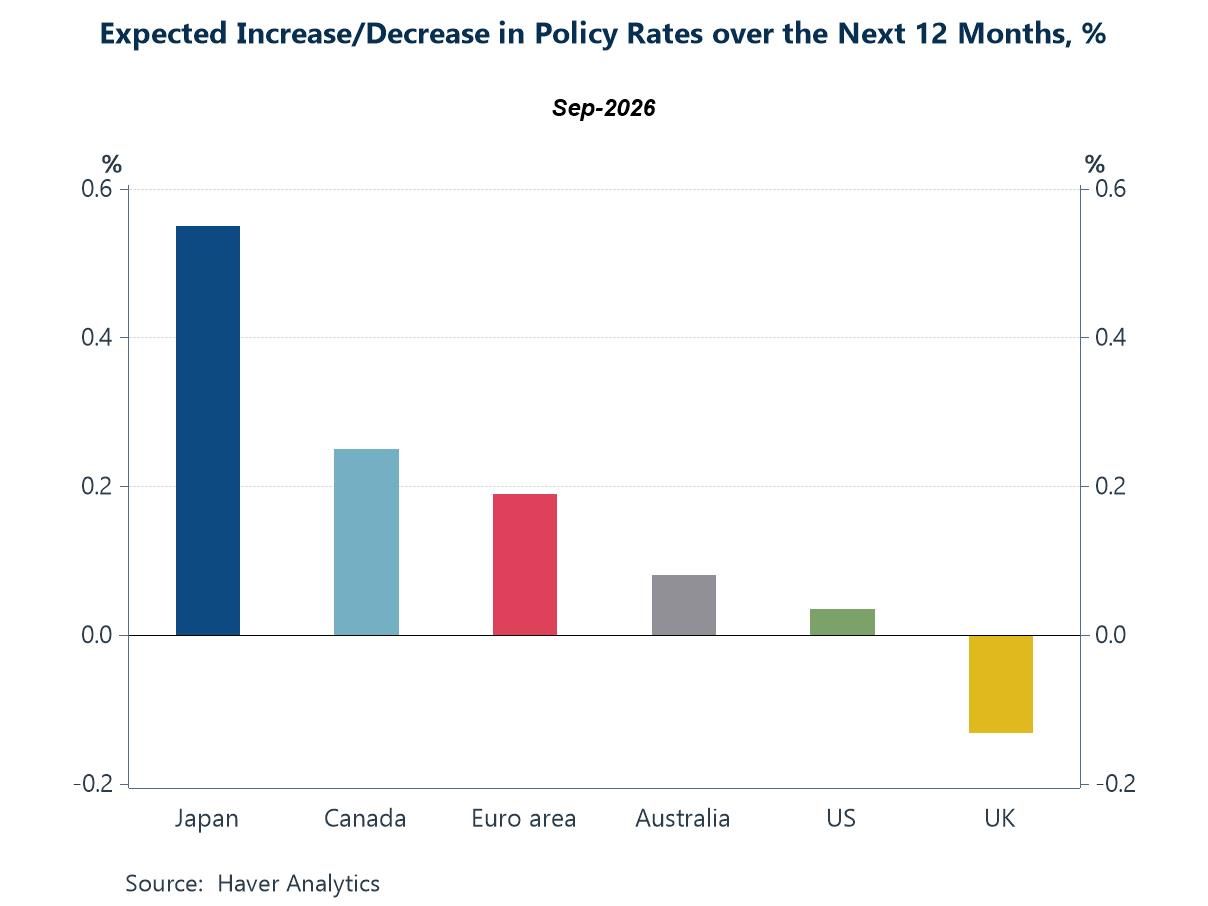
Long-dated US Treasury yields climbed again this week to levels last seen before the financial crisis. Crude oil prices in the meantime eased into the quarter-end as Middle Eastern exports recovered, though Brent will still likely close September higher than it began, and equity markets have absorbed the move in bonds without much difficulty. Forecasters have followed these market moves rather than resisted them. The latest Blue Chip Financial Forecasts survey suggest that policy rates are now expected to be higher in twelve months' time in every major economy, with Japan moving furthest and the United Kingdom least (chart 1). The difficulty is that this repricing is taking place against a world economy that is arguably performing better than a tightening cycle would ordinarily permit. Demand for artificial-intelligence skills is rising in labour markets well beyond the United States (chart 2), world industrial output has accelerated even as core inflation across the G7 has fallen (chart 3), and capital goods orders across the G3 have turned decisively higher (chart 4). Wage growth has slowed in three very different labour markets of late without the increase in unemployment that earlier disinflations demanded (chart 5). Such a combination is rare, and it rests on conditions that may not hold. The constraint that eventually binds could be more physical than monetary, and it is already apparent in the cost of electricity in the regions where the data centres are being built (chart 6).
One Direction The October Blue Chip Financial Forecasts survey marks a shift in tone more than in central expectation. Growth is still holding up and recession is not what the panel expects, though the probabilities attached to Europe remain well above those for the United States. What has changed is the inflation side of the balance. A large majority of panelists now regard inflation as the greater risk (compared with growth), in the US and beyond it, and twelve-month interest-rate paths have been revised up accordingly. Japan has become a more prominent part of the global tightening story, with its policy rate now expected to move furthest over the coming year. The Bank of England is expected to move least. But the direction of travel is the same everywhere, and that is itself a change from the survey compared with a few months ago.
Chart 1: Expected change in policy rates over the next twelve months
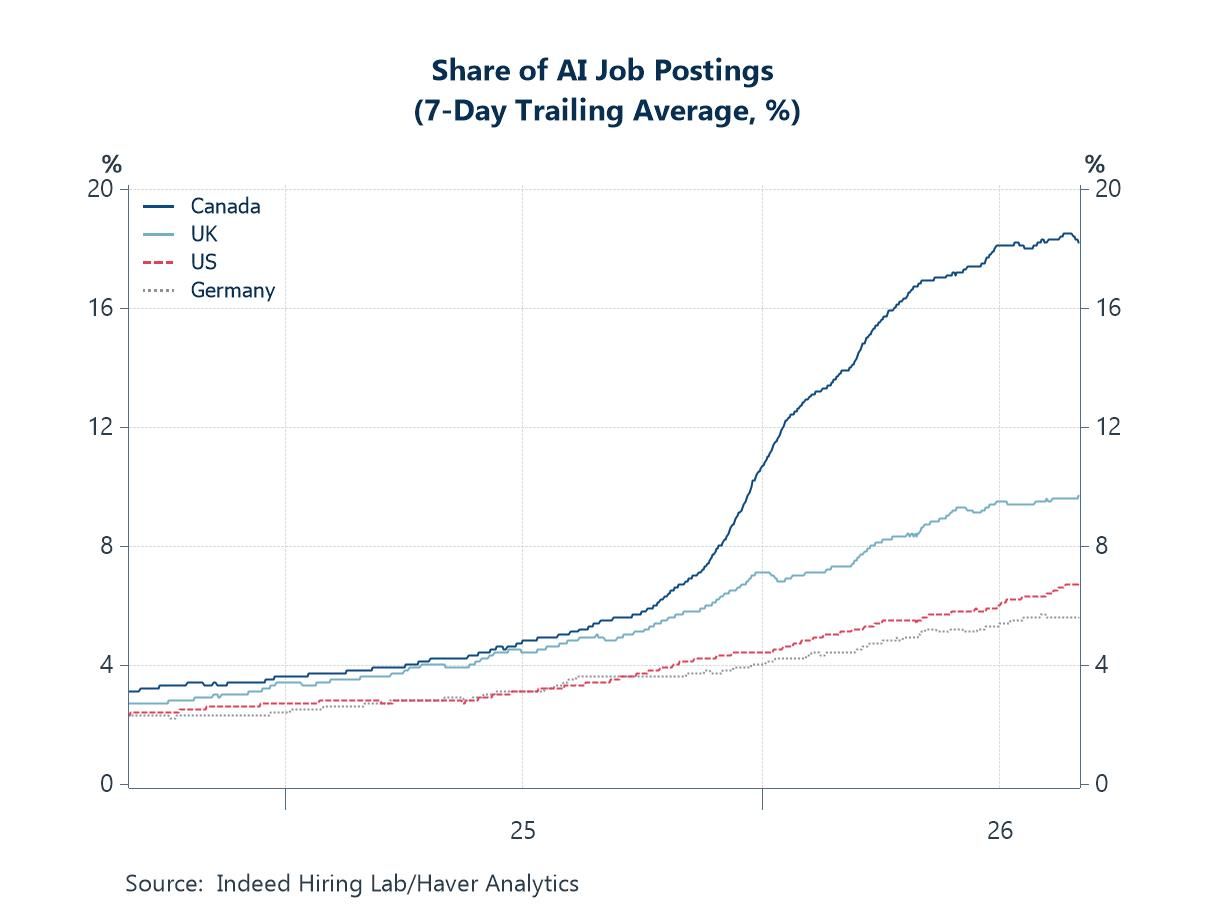
Hiring for the Machine Demand for artificial-intelligence skills has spread well beyond the economies most closely associated with the technology. Canada stands out, with the share of job postings mentioning AI now roughly double the UK’s and well above the American figure. That comparison requires care. Because these are shares of total vacancies, the gap may reflect faster growth in non-AI postings in the United States, rather than stronger absolute demand for AI skills in Canada. Differences in the composition of vacancies also matter, while postings measure hiring intentions rather than actual employment. Even so, the prevalence of AI-related vacancies outside the United States suggests that the technology’s diffusion is not confined to the economies attracting the most investment.
Chart 2: AI-related job postings as a share of all postings
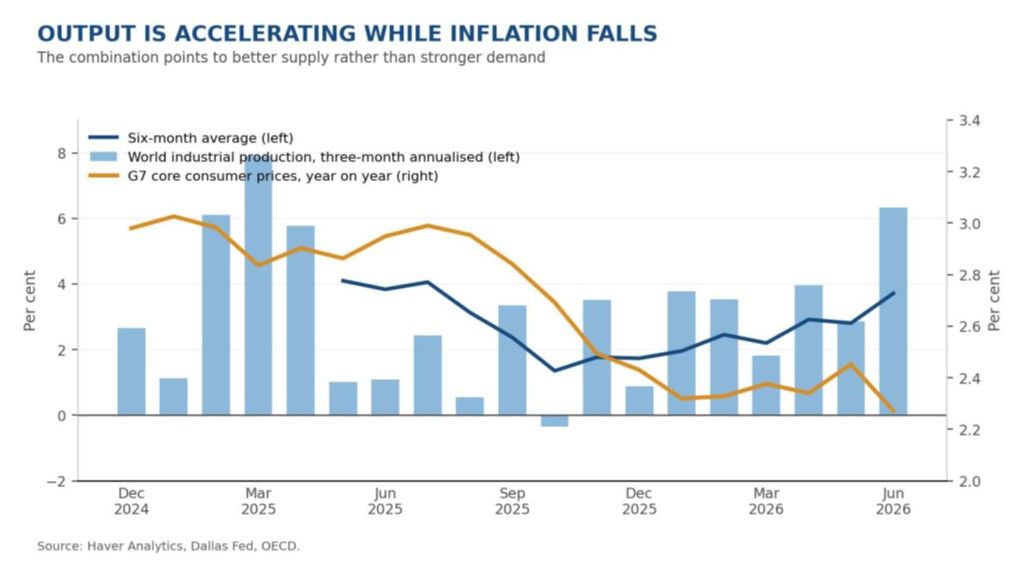
A Favourable Combination World industrial production has been accelerating through the first half of this year while core consumer price inflation across the G7 has continued to drift lower. A demand-led expansion would not usually produce that combination; it would push both series the same way. Starting positions matter here. Output is accelerating from a weak base, so the growth rates flatter the recovery in levels, and inflation has been falling from a rate that sat well above most central bank targets. Nor are the two measures strictly comparable. Industrial production captures a narrow and unusually cyclical slice of activity, while core inflation excludes the energy costs that have done most to unsettle markets this year. The timing is also ambiguous, since prices respond to activity with a lag long enough that the recent divergence may yet close. Still, a more natural reading could be that effective supply has been improving, whether through fuller use of existing capacity or early returns on the investment now under way.
Chart 3: World industrial output and G7 core inflation
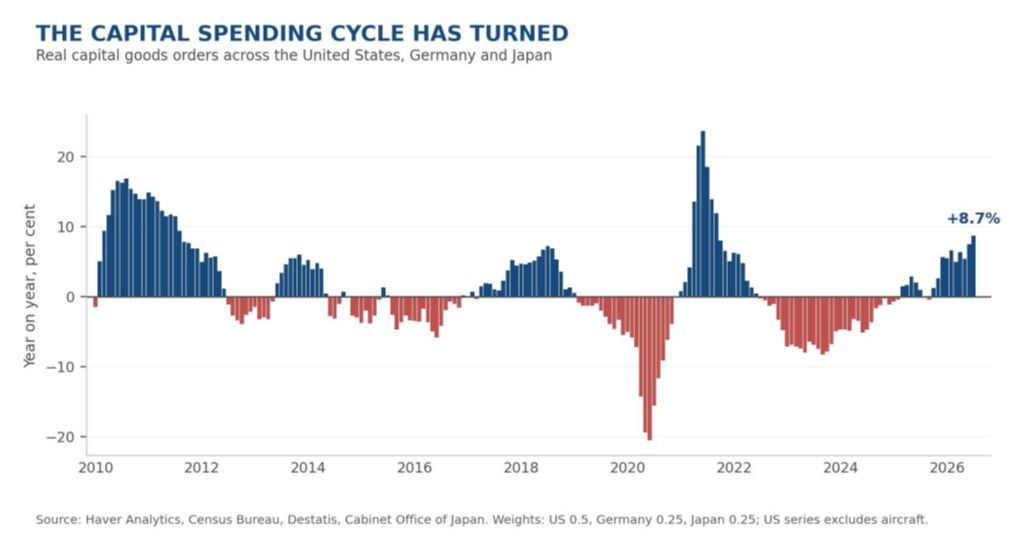
The Capex Cycle Has Turned Real capital goods orders across the United States, Germany and Japan have now been rising for well over a year, and annual growth is close to its strongest since the post-pandemic rebound. Composition matters as much as the growth rate. Data centres and the electrical equipment that serves them account for part of it, but so do defence programmes, grid investment and the reshoring of supply chains, which are being driven by security considerations and are correspondingly insensitive to the cost of capital. In volume terms, orders remain below their 2021 levels, which suggests a cycle that is established but not yet mature. Upswings of this kind have historically run for several years once they take hold.
Chart 4: Real capital goods orders across the United States, Germany and Japan
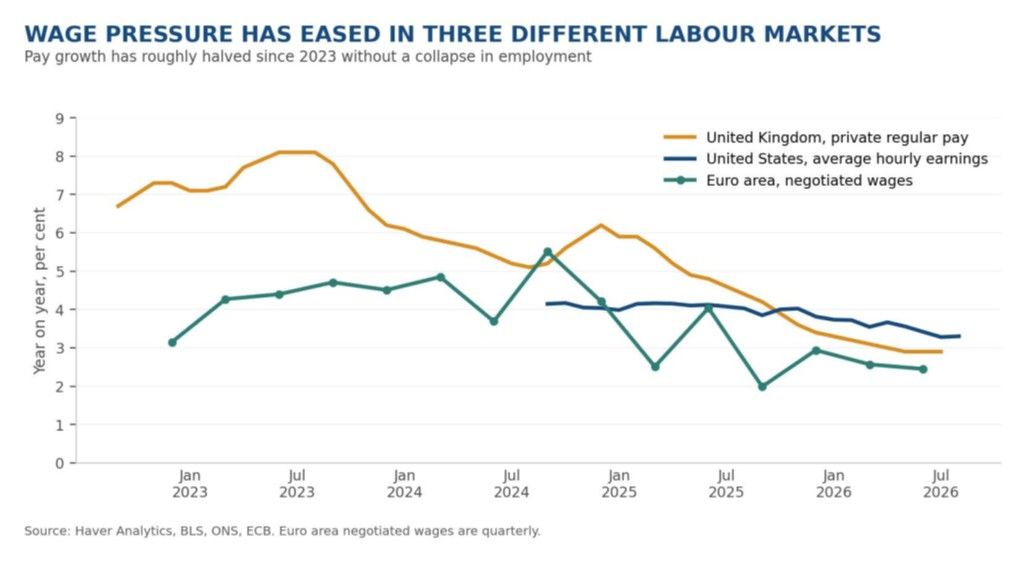
Pay Without Pressure Pay growth has roughly halved since 2023 in the United States, the euro area and the United Kingdom, three labour markets with very different bargaining structures and degrees of centralisation. That common path is striking, and it has been achieved without a sharp rise in unemployment. The temptation is to credit restrictive monetary policy, but the absence of any material loosening in employment argues against it. A demand-restraint channel operating with this much force should have left a clearer mark on jobs. The simpler explanation is that pay was catching up with an inflation shock and has fallen back as that shock has faded, helped by a recovery in labour supply and by an adjustment that has run through vacancies rather than through headcount. Whatever the cause, the consequence is the same. Where firms are producing more without employing proportionately more people, unit labour costs fall, margins hold and the inflationary consequences of resilient demand are muted. That is the condition on which the current configuration rests, and it is the first thing that would change were capacity to become binding.
Chart 5: Wage growth in the United States, the euro area and the United Kingdom
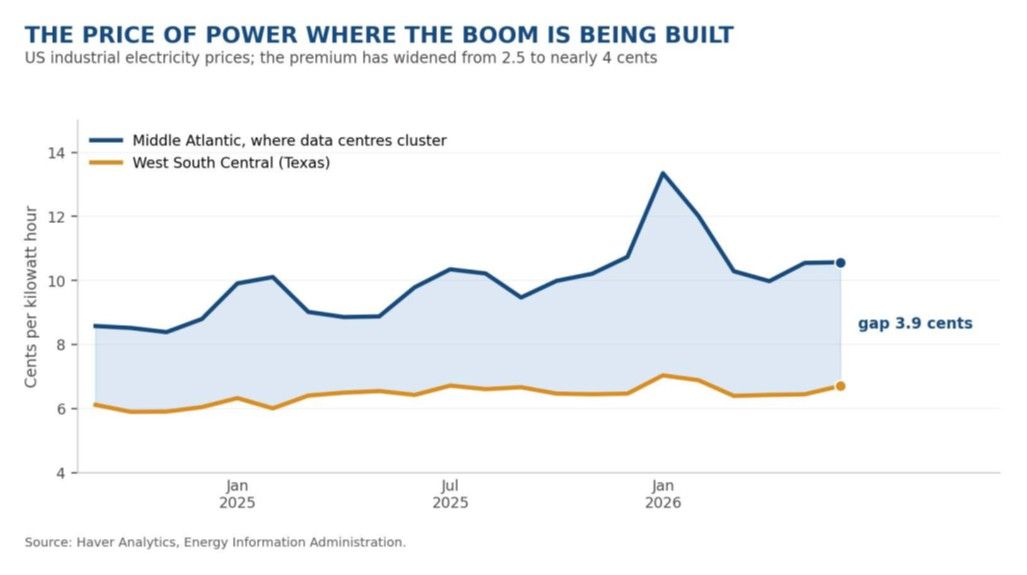
The Price of Power Industrial electricity prices in the Middle Atlantic region in the United States, where data centre capacity is most heavily concentrated, have pulled steadily further away from those in Texas over the past two years. A regional premium is not evidence of a national energy shortage, and such differences have always existed. What it does perhaps indicate is where the physical limits bite first. Digital capital can be installed in months; generating plant, transmission lines and grid connections cannot, and the permitting queues are long. Should the cost of power in the places where the boom is being built keep rising faster than elsewhere, the productivity gains will be absorbed by the energy bill rather than showing up in lower costs or wider margins. The favourable part of this expansion is real enough. But it is a phase, and the grid is where its limits will be tested first.
Chart 6: Industrial electricity prices in the Middle Atlantic and Texas

Andrew Cates
AuthorMore in Author Profile »Andy Cates joined Haver Analytics as a Senior Economist in 2020. Andy has more than 25 years of experience forecasting the global economic outlook and in assessing the implications for policy settings and financial markets. He has held various senior positions in London in a number of Investment Banks including as Head of Developed Markets Economics at Nomura and as Chief Eurozone Economist at RBS. These followed a spell of 21 years as Senior International Economist at UBS, 5 of which were spent in Singapore. Prior to his time in financial services Andy was a UK economist at HM Treasury in London holding positions in the domestic forecasting and macroeconomic modelling units. He has a BA in Economics from the University of York and an MSc in Economics and Econometrics from the University of Southampton.
More Economy in Brief