U.S. GDP Growth Revised Up in both Q1 and Q2; Benchmark Revision Small
by:Sandy Batten
|in:Economy in Brief
Summary
- The third estimate of Q2 real GDP raised growth to 2.2% q/q saar from 1.5% in both the advance and second estimate.
- In the annual benchmark revision, Q1 growth was revised up to 2.5% from 2.1%.
- The sources of the Q3 revision were rather widespread—leading the way, faster consumption and nonresidential investment and a smaller drag from inventories
- The strong Q2 domestic demand growth reported in the advance and second estimates was revised even stronger.
- The Q2 rise in corporate profits were revised down slightly but still posted the strongest quarterly advance since Q2 2021.
- Total benchmark revisions were relatively small with average annual GDP growth from 2020 to 2025 revised up only 0.1%-point to a robust 3.4%.
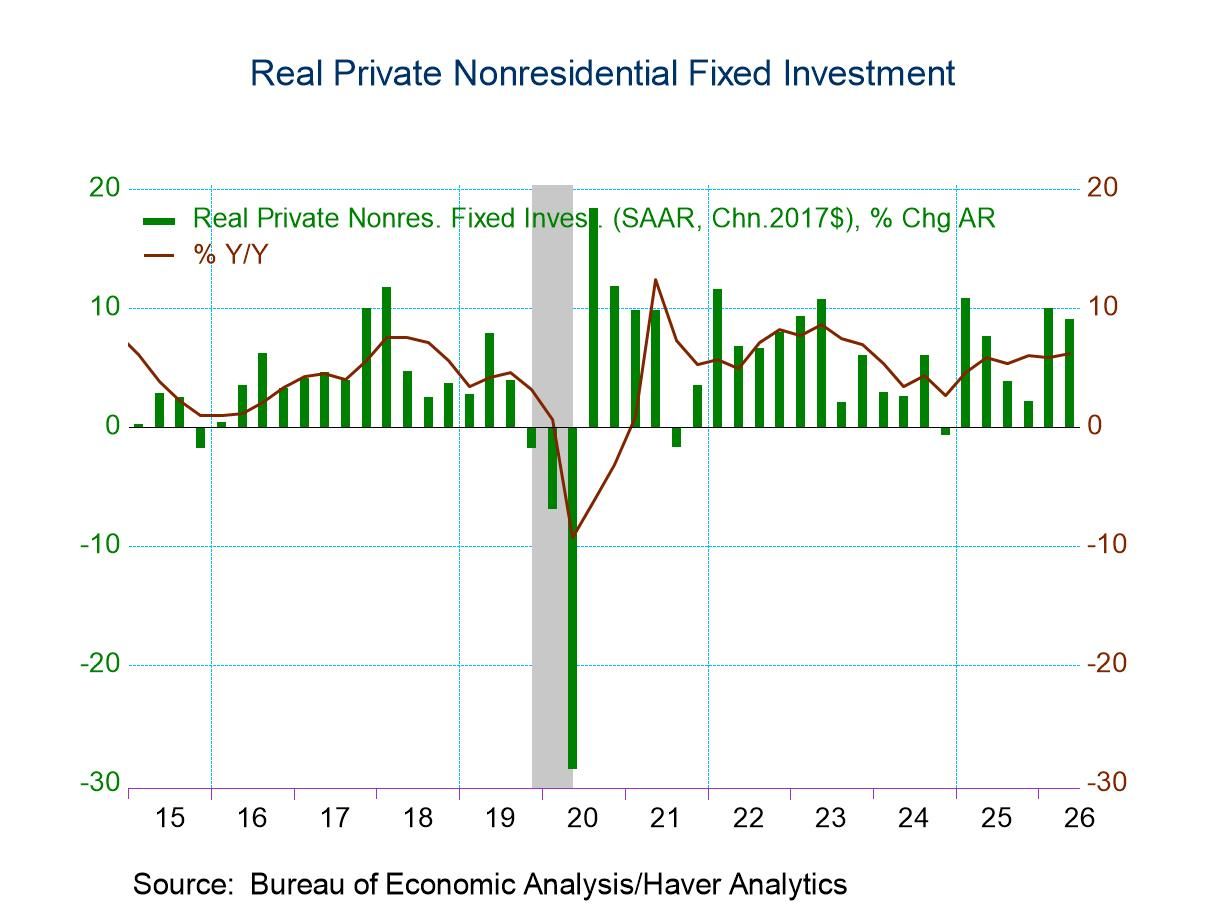
- The largest annual revision was a 0.5%-point upward revision to nonresidential fixed investment growth.
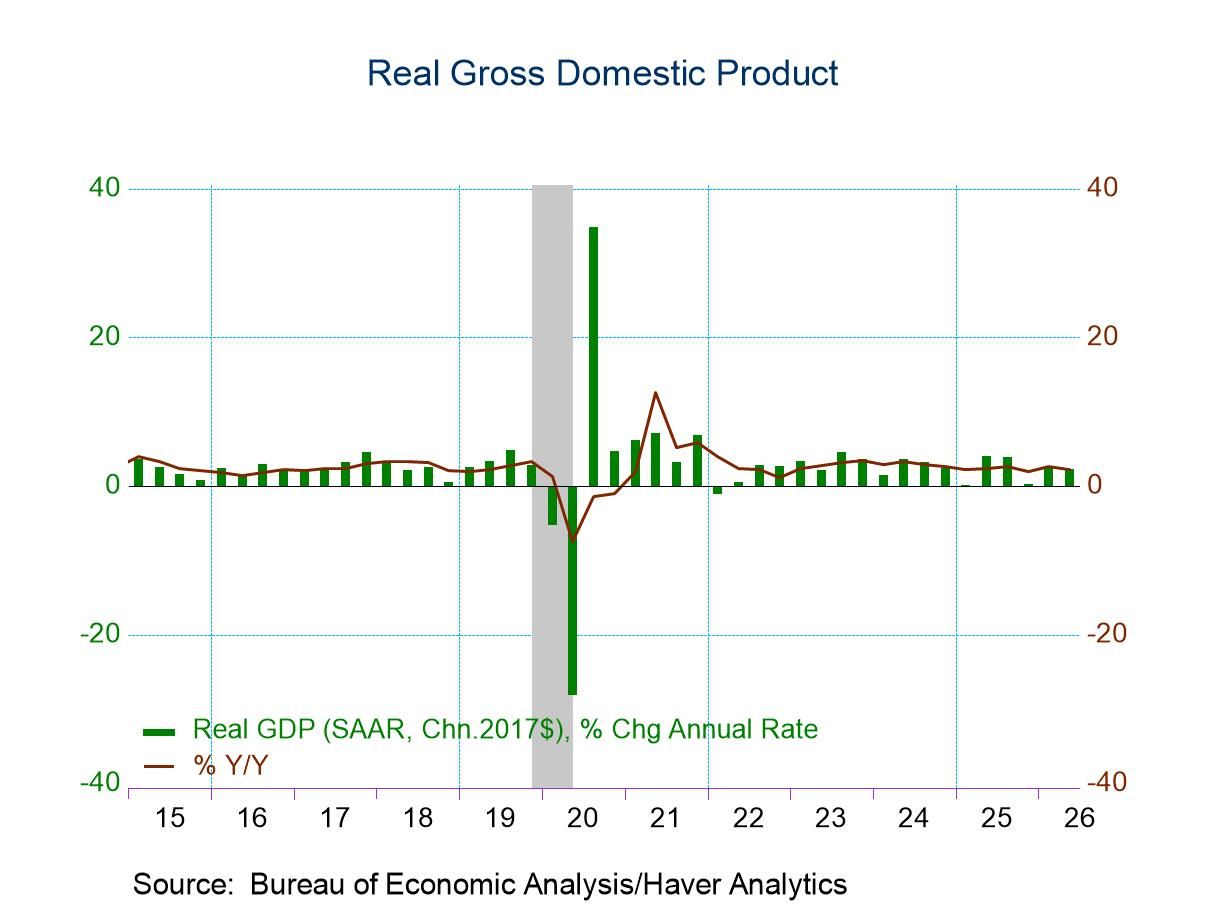
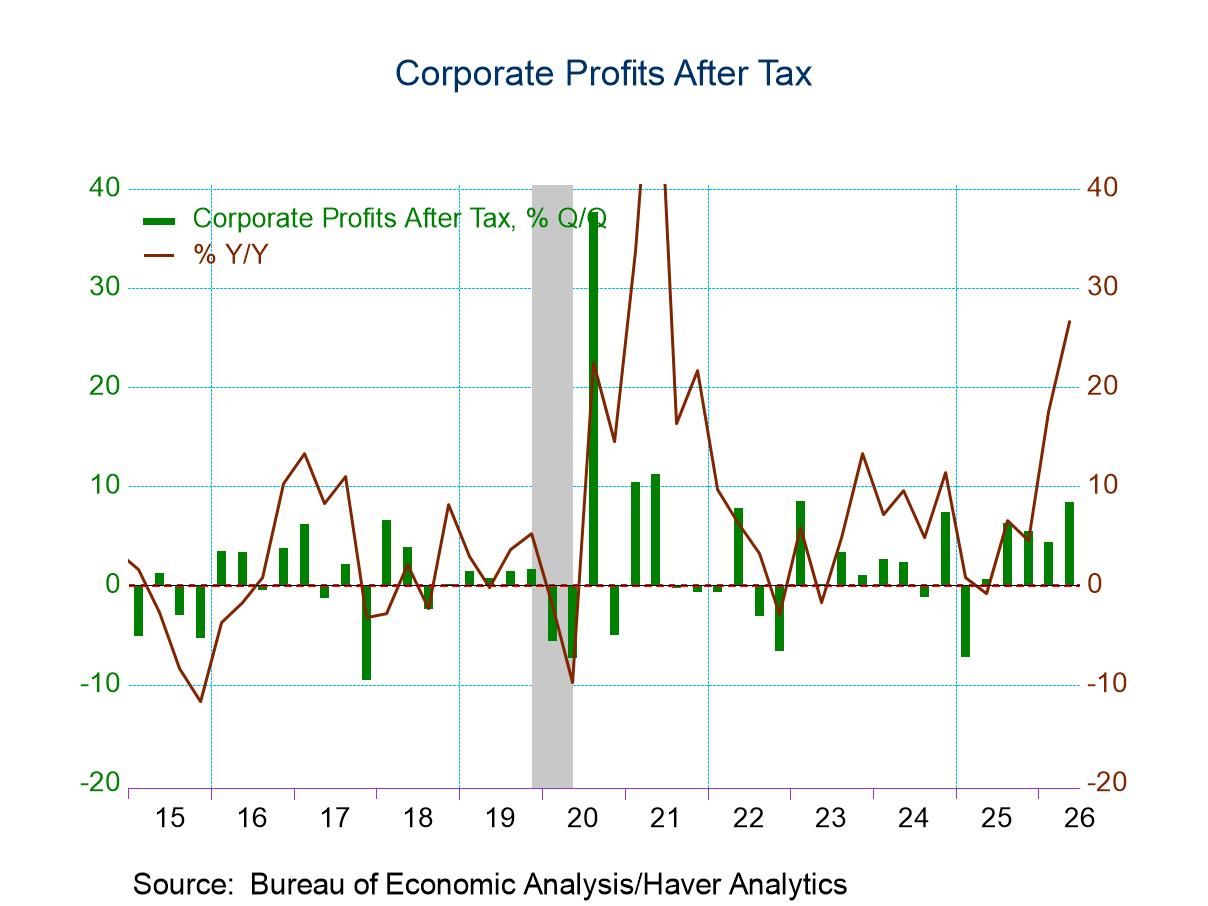
In the third estimate, real GDP grew 2.2% q/q saar in Q2, up from 1.5% in both the advance and the second estimates, according to the Bureau of Economic Analysis. The Action Economics Forecast Survey looked for an unrevised 1.5% quarterly gain. Compared with a year ago, GDP was up 2.2% versus 2.1% in both the advance and second estimates. The upward revision to Q2 GDP growth were rather widely spread across expenditure categories, led by personal consumption expenditures, nonresidential fixed investment and a smaller drag from declining inventories. This was the fifth consecutive quarter in which inventories declined, a very unusual occurrence when the economy is not in a recession. This release also contained the second estimate of corporate profits. Profit growth was revised down to 8.9% q/q not annualized from 9.1% in the first estimate. However, this was still the fastest quarterly advance for profits since Q2 2021.
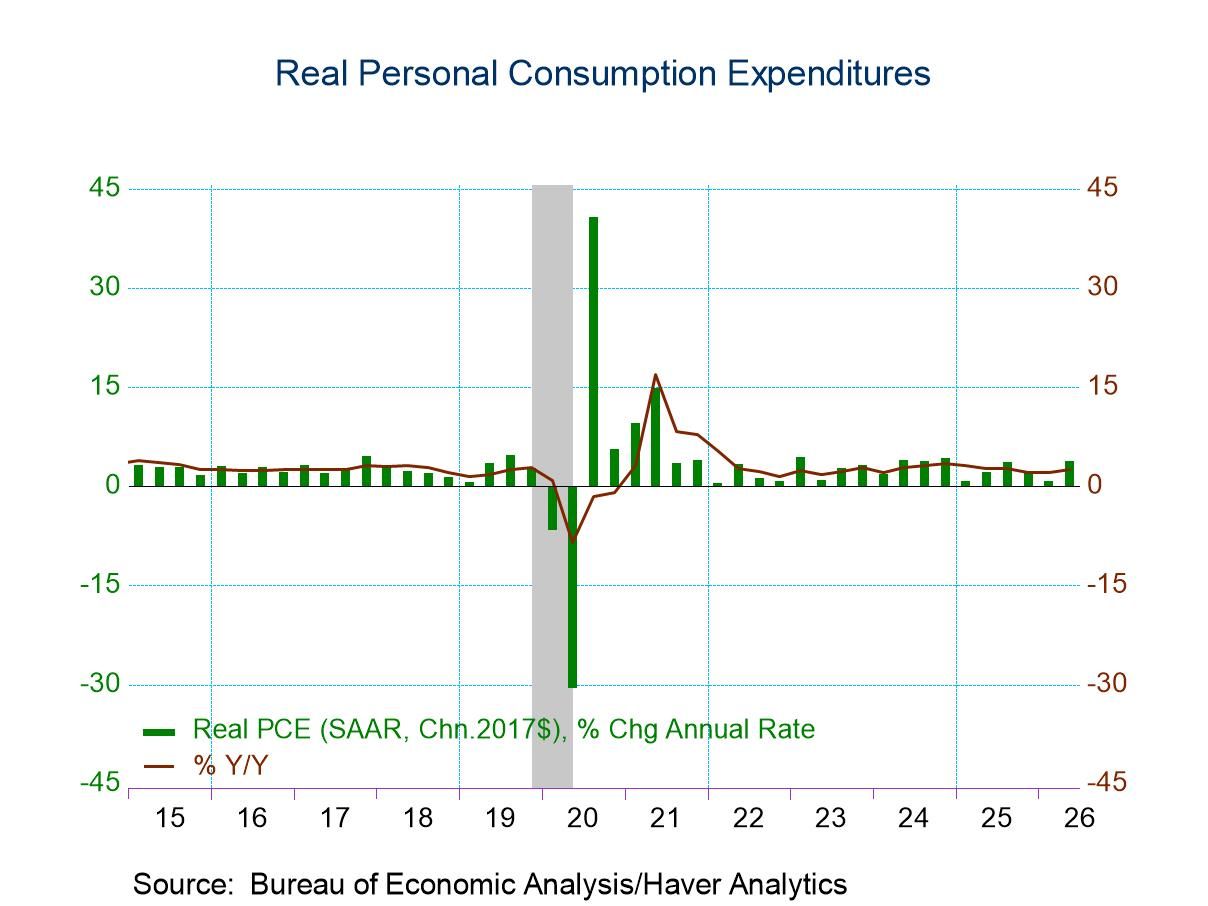
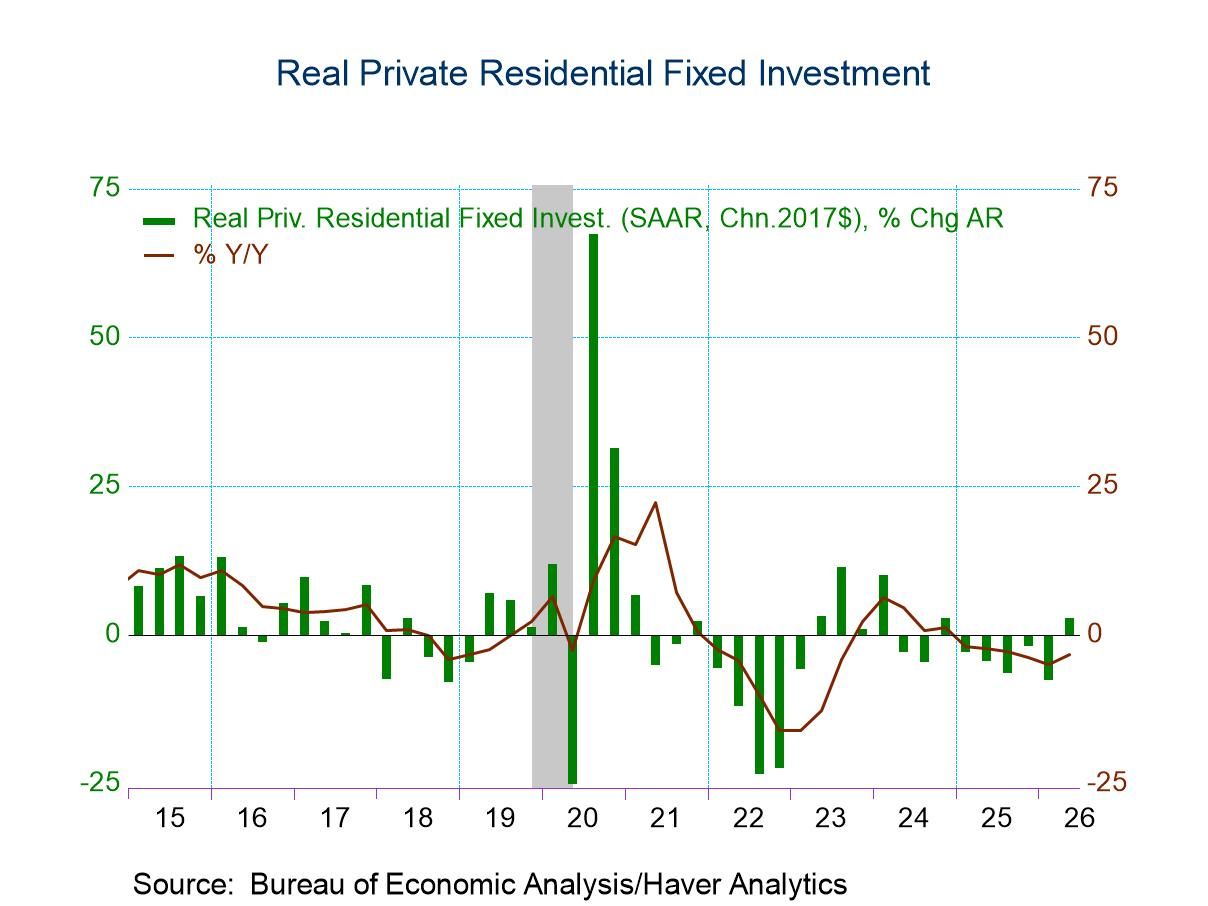
Personal consumption expenditures increased 3.8% q/q saar in the third estimate of Q2, up from 3.4% in the second estimate and 3.2% in the advance report. Faster growth of spending on durable goods and on services were the primary factors behind the upward revision to consumption. Fixed investment growth was also revised faster. Growth of nonresidential fixed investment was revised up to 9.0% from 8.5% in the second estimate, led by upward revisions to both structures and intellectual property. Residential investment growth was also revised up to 2.8% from 1.2% in the second estimate.
Both export and import growth were revised slightly faster but resulted in only a slight widening of the trade deficit and no revision to on overall GDP growth. The previously estimated decline in total government spending growth was revised smaller with a smaller decline in federal spending than previously estimated and a larger increase in state and local government.
Reflecting the upward revision to personal consumption and fixed investment, real domestic demand growth, already strong in the previous two estimates, was revised even stronger. Real final sales to domestic purchasers (GDP less inventory investment and net exports) increased a well above trend 3.8% q/q saar in Q2 versus 3.3% in the second estimate and 3.1% in the advance report. Real final sales to private domestic purchasers (the Fed’s preferred measure of domestic demand) jumped 4.6% q/q in Q2, its largest quarterly gain since Q1 2023, up from 4.2% in the second estimate and 3.9% in the advance report.
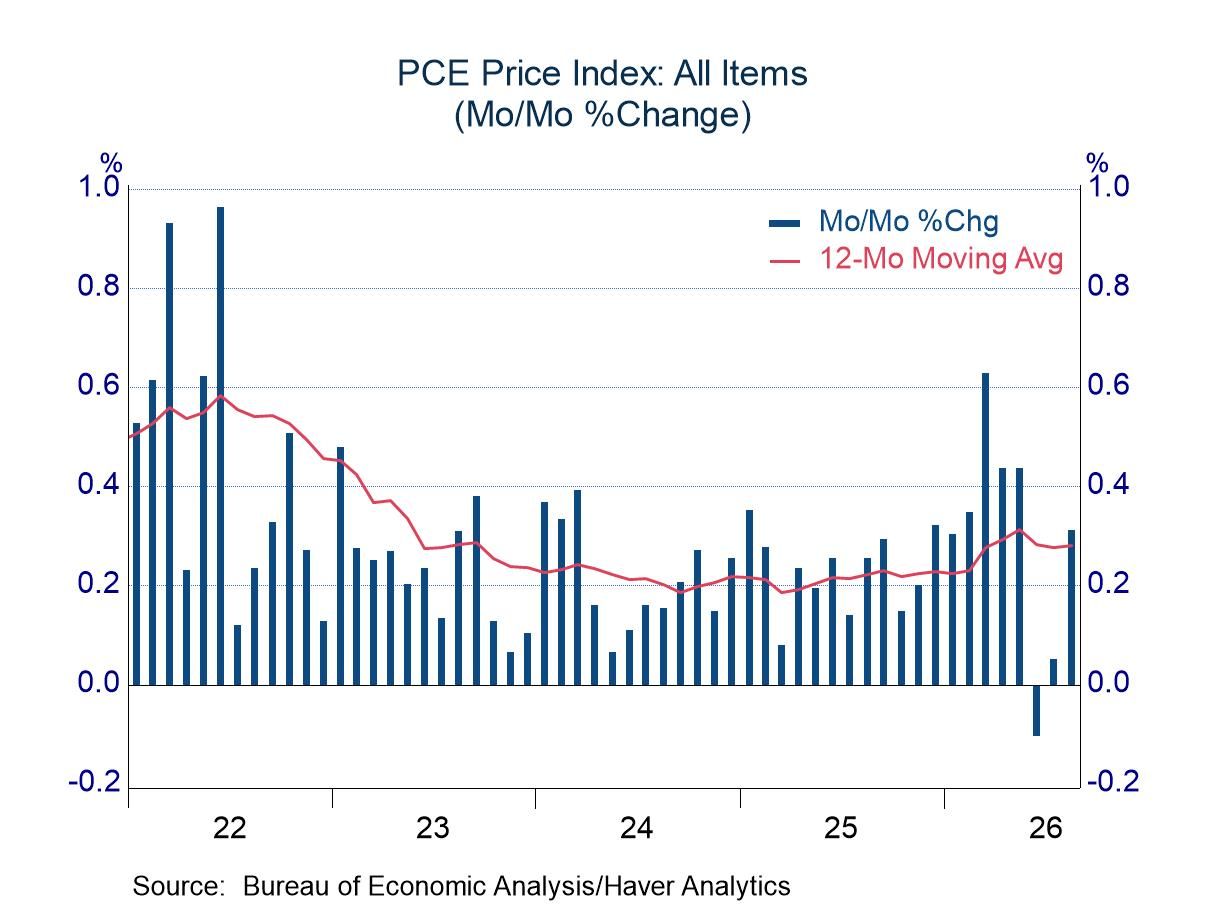
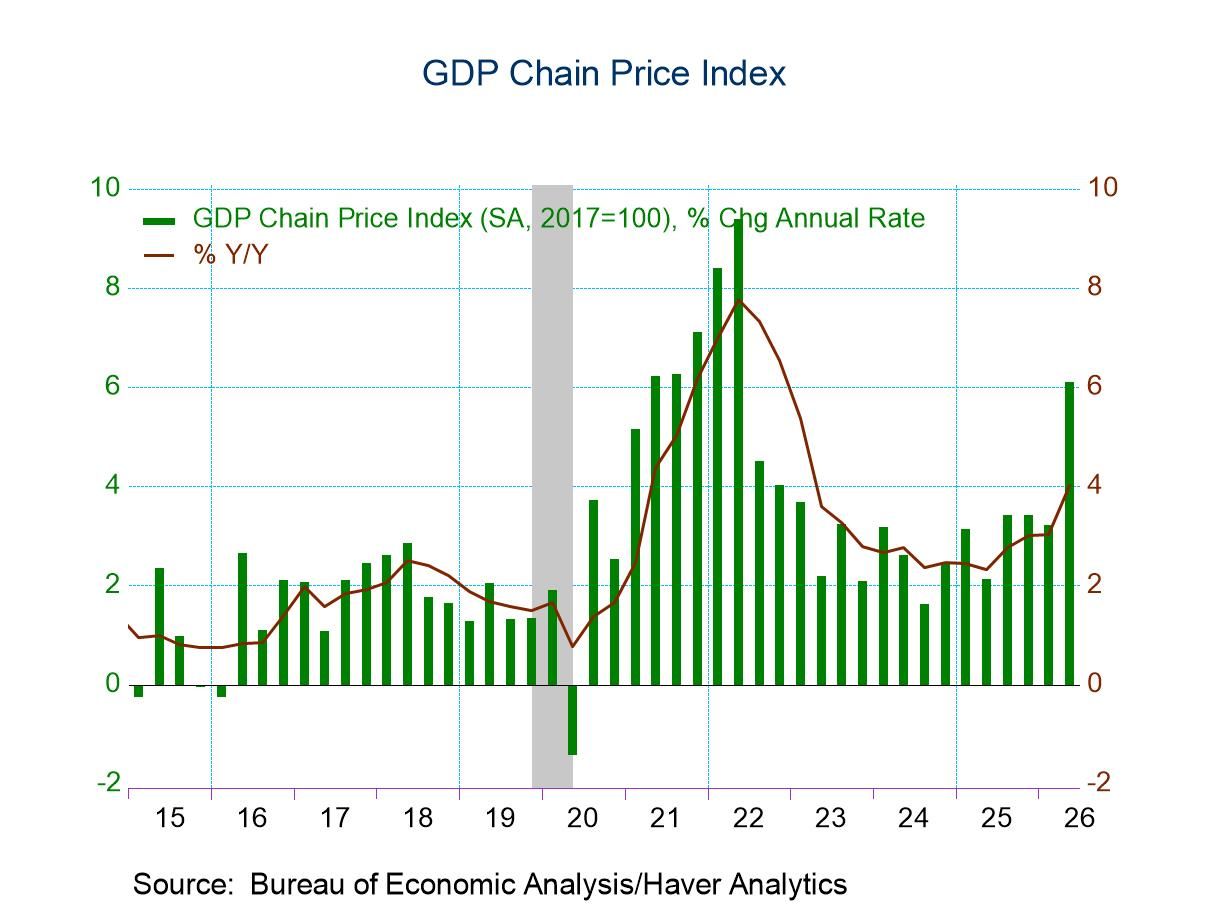
After having been revised higher in the second estimate, GDP inflation measures were revised down in the third estimate. GDP price inflation was revised down to 6.1% q/q saar in the third estimate from 6.4% in the second estimate, still due mostly to the surge in energy prices that occurred in Q2. The core GDP price index rose a revised 4.2%, down from 4.4% in the second estimate. PCE price inflation (the measure the Fed targets) in Q2 was also revised down to 5.0% from 5.3% in the second estimate, again reflecting the surge in energy prices, with core PCE inflation revised down to 3.3% from 3.6% previously but still well above the Fed’s 2% target.
Today’s report also included annual benchmark revisions for the period Q1 2021 to Q1 2026. Annual updates provide the opportunity to incorporate improvements that are generally of three types: (1) statistical changes to incorporate newly available and revised source data and to introduce new and improved methodologies, (2) changes in definitions to more accurately portray the evolving U.S. economy and to provide consistent comparisons with data for other national economies, and (3) changes in presentations to reflect the definitional and statistical changes, where necessary, or to provide additional data or perspectives for users. In addition, seasonally adjusted statistics are evaluated and revised during annual updates to reflect recalculated seasonal factors.
In general, these revisions were generally small. After the benchmark revision, annual real GDP grew 3.4% at an annual rate from 2020 to 2025, up slightly from the previously reported 3.3% increase. Real personal consumption expenditures growth slowed marginally to a still well-above trend 3.9% from 4.0% previously. Nonresidential business investment posted the largest upward revision, rising 5.9% from 2020 to 2025 versus 5.4% previously estimated. Residential investment fell a revised 1.3%, down slightly from -1.1% previously. Growth of exports and imports were revised up marginally. And government spending growth was revised up to 1.8% from 1.4%.
The GDP data can be found in Haver’s USECON and USNA databases. USNA contains virtually all of the Bureau of Economic Analysis detail in the national accounts. The Action Economics consensus estimates can be found in AS1REPNA.

Sandy Batten
AuthorMore in Author Profile »Sandy Batten has more than 30 years of experience analyzing industrial economies and financial markets and a wide range of experience across the financial services sector, government, and academia. Before joining Haver Analytics, Sandy was a Vice President and Senior Economist at Citibank; Senior Credit Market Analyst at CDC Investment Management, Managing Director at Bear Stearns, and Executive Director at JPMorgan. In 2008, Sandy was named the most accurate US forecaster by the National Association for Business Economics. He is a member of the New York Forecasters Club, NABE, and the American Economic Association. Prior to his time in the financial services sector, Sandy was a Research Officer at the Federal Reserve Bank of St. Louis, Senior Staff Economist on the President’s Council of Economic Advisors, Deputy Assistant Secretary for Economic Policy at the US Treasury, and Economist at the International Monetary Fund. Sandy has taught economics at St. Louis University, Denison University, and Muskingun College. He has published numerous peer-reviewed articles in a wide range of academic publications. He has a B.A. in economics from the University of Richmond and a M.A. and Ph.D. in economics from The Ohio State University.
More Economy in Brief