

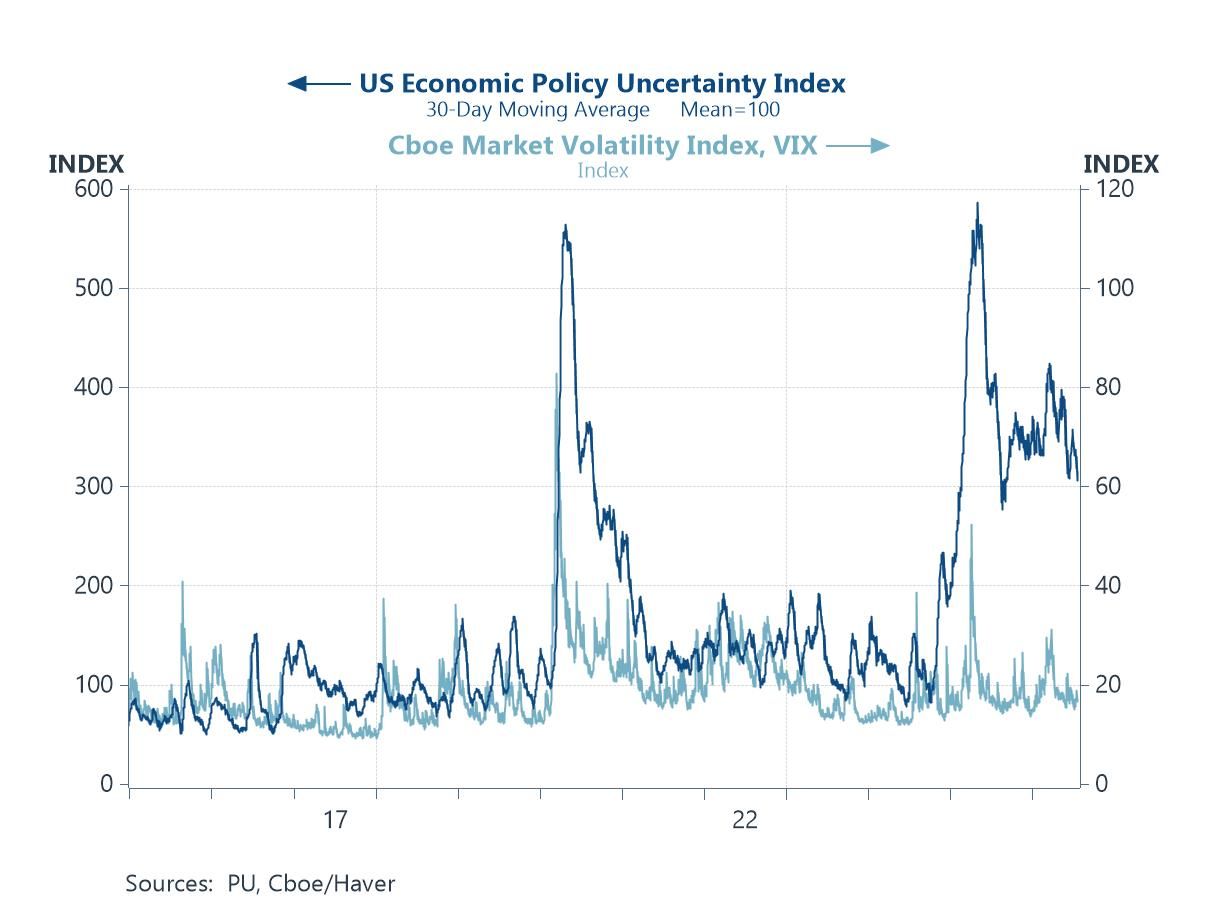
Global financial markets have retained a notably composed tone this week, even as the geopolitical backdrop turned more unsettled once again. News of renewed skirmishes between the United States and Iran reintroduced a risk premium that investors had only lately begun to set aside, yet equities held firm and volatility stayed low. Last week's US inflation and Chinese GDP releases did little to disturb that calm, though the Chinese figures laid bare how soft domestic demand there has become. That composure is an enduring - and notable - feature. Measures of policy uncertainty remain elevated by historical standards, yet market volatility has sunk to the low end of its range — a divergence that says a good deal about the prevailing mood (chart 1). A new risk-appetite gauge from the Federal Reserve Bank of Kansas City, now carried on the Haver platform, points the same way, with investors still firmly disposed to take on risk (chart 2). Beneath the surface, though, evidence of supply-side stress is mounting, with freight rates and suppliers' delivery times pointing to renewed strain (chart 3) — a theme of this week's podcast with the Baltic Exchange. Nor is the pressure confined to manufacturing: firmer grain prices raise the question of whether a developing super El Niño is at work (chart 4). On the demand side, Haver's calculation of China's credit impulse helps to account for the softness in last week's growth figures (chart 5). And beyond the cycle lies the structural, as Britain welcomes a new prime minister in Andy Burnham to a persistent growth problem in which the cost of energy looms large (chart 6).
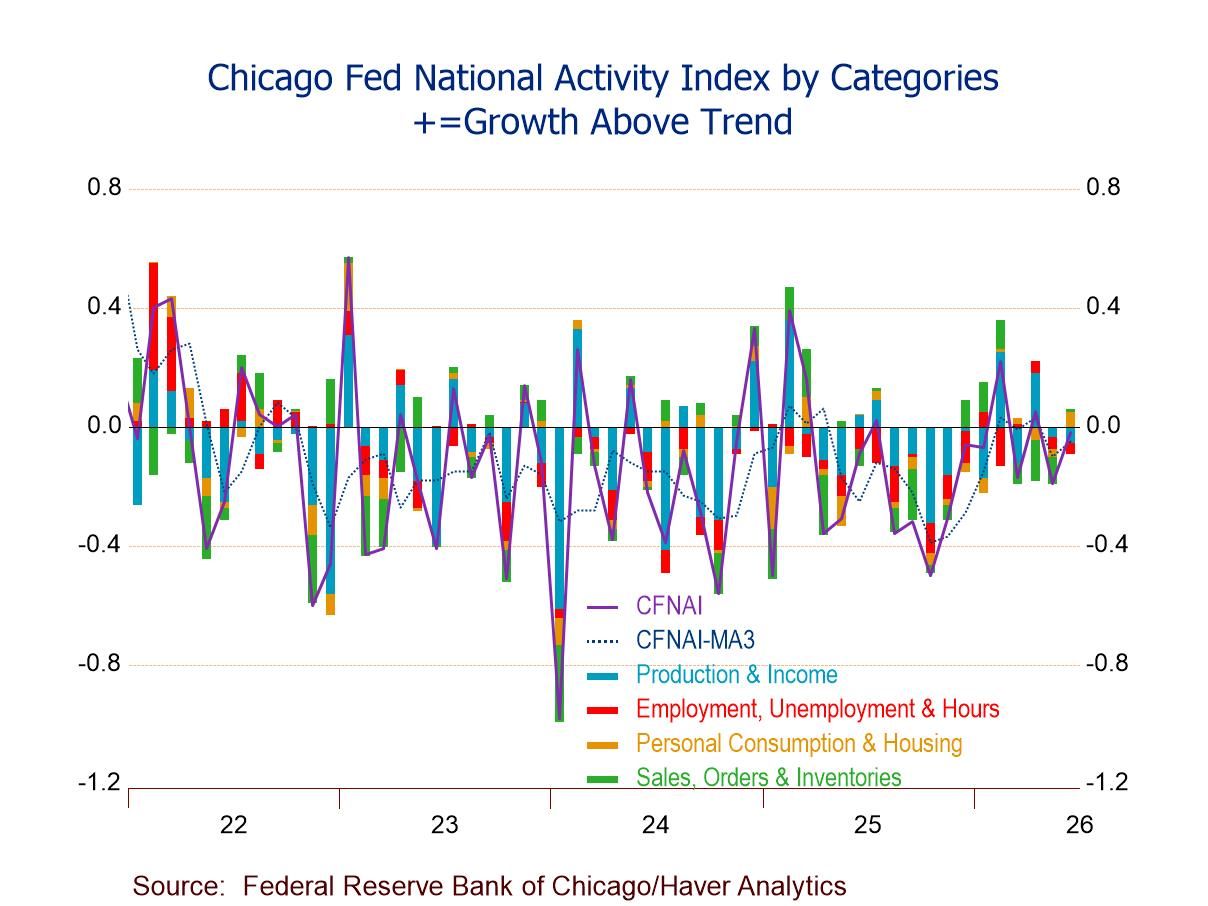
- CFNAI up to -0.02 in June, remaining negative for the third time in four months.
- One of four CFNAI components down m/m; two make negative contributions.
- CFNAI-MA3 slightly up to -0.05, third negative reading in four mths.; above -0.70 (recession signal).
- CFNAI Diffusion Index down to -0.03, lowest since February.
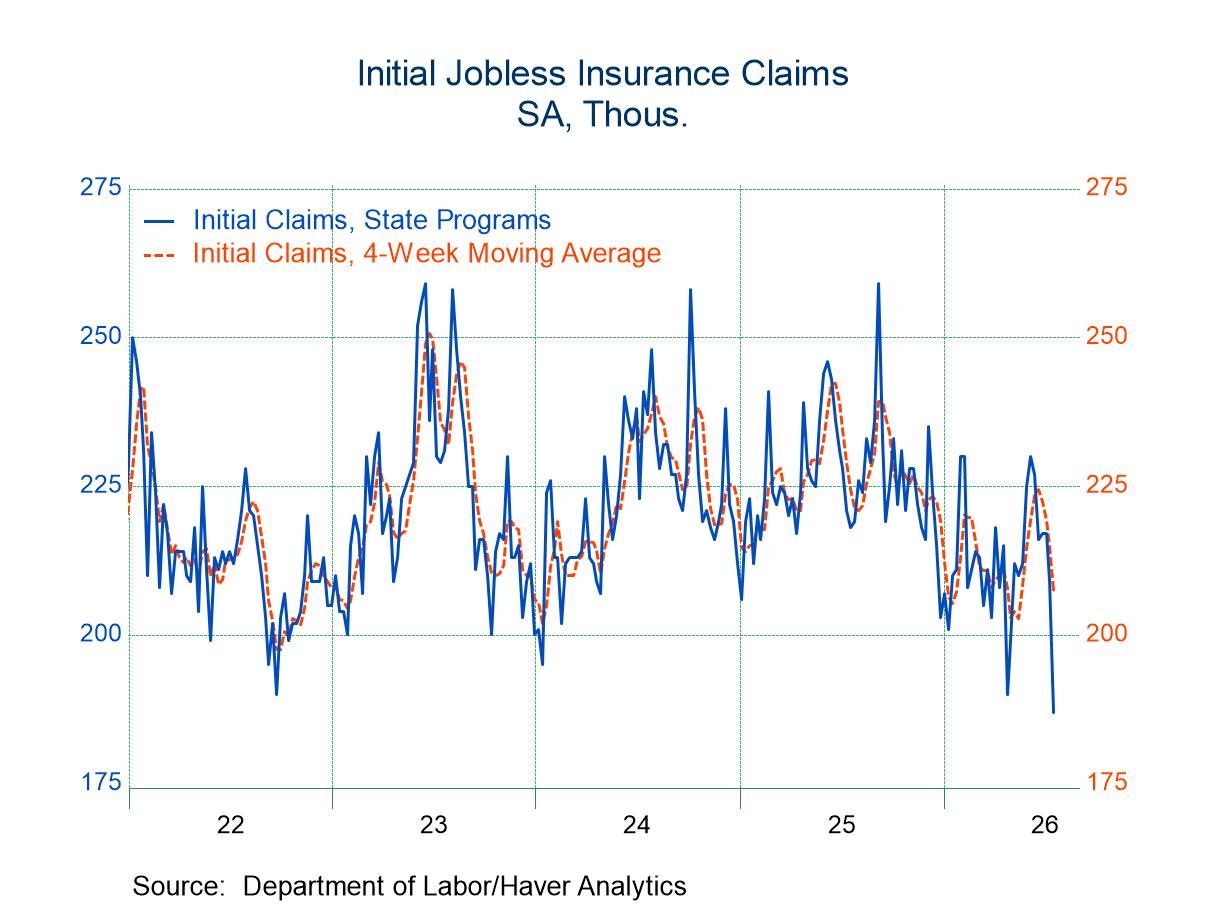
- New claims dropped by 22,000 to 187,000 in the week ending July 18, the lowest level since 1969.
- Continuing claims declined by 2,000 to 1.796 million in the week ending July 11.
- The insured unemployment rate was unchanged at 1.2% in the week of July 11.
 France| Jul 23 2026
French Manufacturing Survey Improves
French manufacturing saw its climate index rise to 101.3 in July from 100.2 in June, still below its May level and exceeded by readings from December 2025 to February 2026. Apart from those four readings, the French index was last stronger in March 2024. On data back to April 2023, some 40 observations, the industry climate index has been higher only six times. Still, on data back to 2001 the current climate reading has a 53-percentile standing. While the current reading is slightly above par on a long historic timeline and just above its median reading, which occurs at a ranking of 50, its 53-percentile ranking marks it as slightly above its historic median; however, it is quite strong compared to the past 40 months (3 1/3 years).
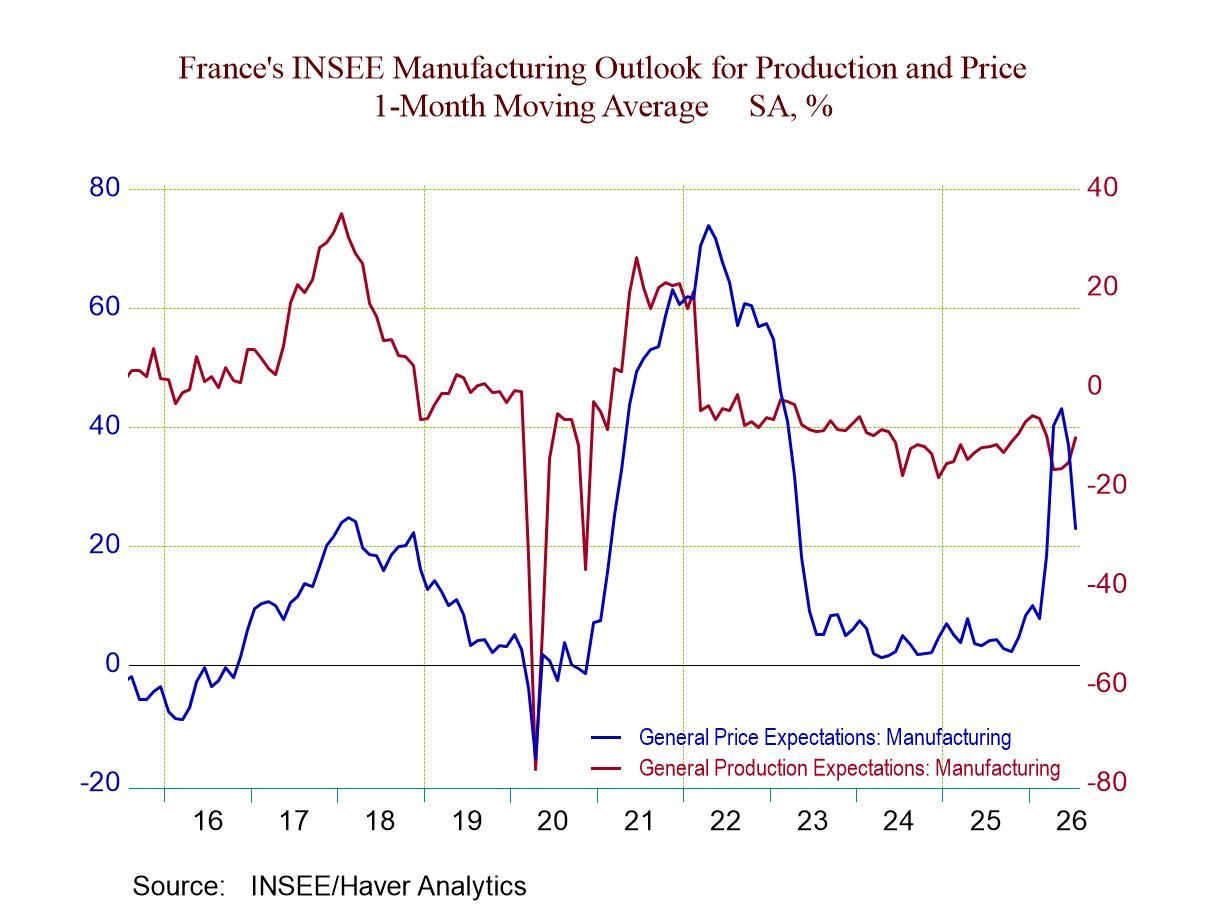
Manufacturing production expectations have improved slightly over the past year from -11.9 to -10.1, with a 38.6 percentile standing, below its historic median.
The recent trend for production has improved even more sharply over the past year from -2.5 to +7.3, with a 59.8 percentile standing, well above its historic median. Interestingly, when asked about their own industry, survey respondents were less upbeat as the current reading at -0.6 was better than its year-ago -5.0, but only at a 16.3 percentile standing, a rather dismal showing.
Orders & demand and foreign orders & demand both moved up from their year-ago readings, improving by some six to eight points from their respective year-ago levels. Orders & demand overall have a 69.9 percentile standing, quite a solid reading, compared to foreign orders & demand, with only a slightly above-median 50.7 percentile standing.
Pricing finds both the own likely price level and the overall manufacturing level higher than they were a year ago. Own prices are higher by 3.1 points while manufacturing prices in general are deemed higher by 18.8 points, a massive difference. But the price levels by each response, placed in a percentile standing mode, produce standings at about the 75th percentile for each of them.
The graph shows French manufacturing prices on another up-down cycle. The down phases triggered rapidly this time; however, it is probably going to give way to another spurt with the Middle East progress unraveling that progress; it has already happened in the real world but is not yet reflected in published economic reports. That means we will have to monitor the industry recovery path closely again.
 USA| Jul 22 2026
U.S. Mortgage Applications Rose in the July 17 Week
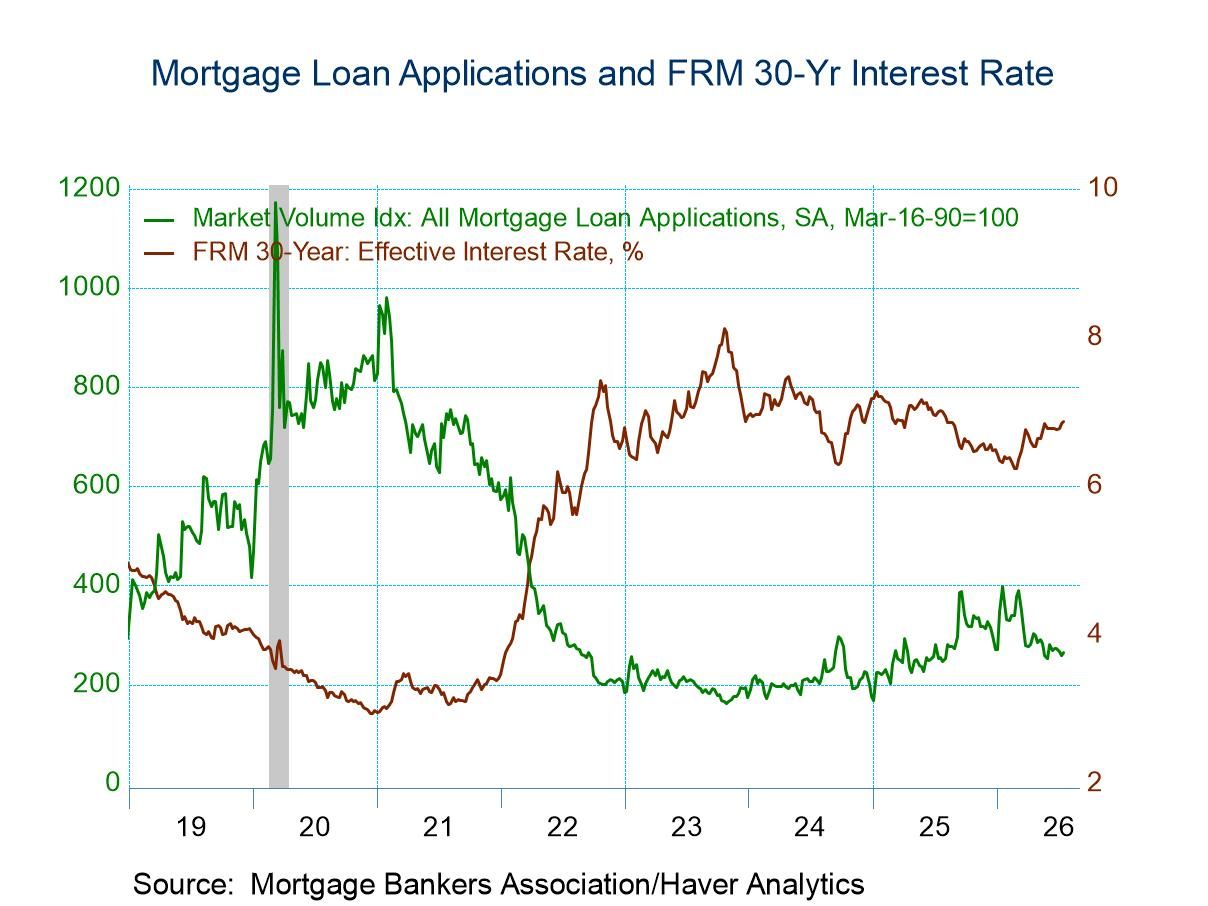
- Applications for loans to purchase rose in the latest week, while applications for loan refinancing declined.
- Interest rate on 30-year fixed-rate loans rose 2bps to 6.87%.
- Average loan size rose.
 United Kingdom| Jul 22 2026
U.K. Headline and Core Inflation Rates Slow Sequentially as BOE Gets Ready to Meet
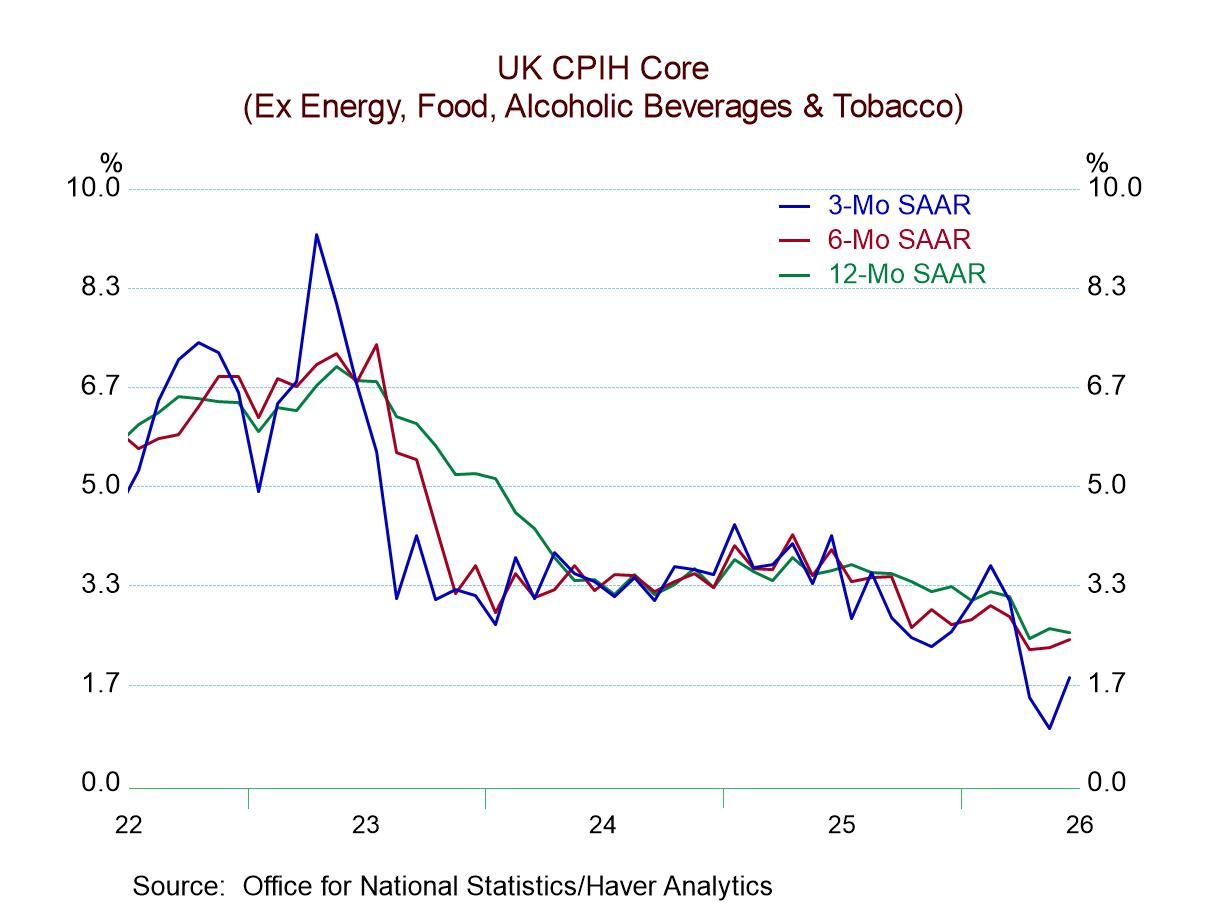
Inflation progress in the U.K. continues to make its way despite a month-to-month increase in the pace for the HICP measure, as well as for the CPIH headline and its core. The two headline measures for the CPIH and the HICP accelerated in June to 0.2% after each posted a small 0.1% increase in May. The CPIH core, which excludes energy, food, alcohol, and tobacco, advanced by 0.3% in June after rising by 0.2% in May.
Monthly data are ‘noisy’: These are minor and technical month-to-month changes since we're measuring inflation in tenths; this is an increase in the smallest unit that we present. If we look at the inflation progress over broader periods of three months, six months, and 12 months, we find there are ongoing decelerations of inflation in the HICP, the CPIH, and the CPIH core measures. I will continue this discussion solely in terms of the CPIH measures.
Sequential inflation: Headline inflation for the CPIH clocks 2.8% over 12 months; the annualized rate falls to 2.6% over six months and falls further to 1.8% annualized over three months, a clear pattern of progress. Core inflation on the CPIH gauge is also 2.8% over 12 months; it also falls to 2.6% over six months, but its deceleration over three months is to a pace of 2.3% (instead of 1.8% for the headline). Still, that's ongoing progress and the three-month 2.3% pace of core inflation is getting quite close to the Bank of England’s 2% objective.
Component behavior: We're going to further evaluate inflation by looking at how the components behave over different periods. In June, inflation accelerated in 66.7% of the categories. In May, it accelerated in 58.3% of the categories, whereas in April, it accelerated in only 50% of the categories. Inflation acceleration is going in the wrong direction to appease monetary authorities. However, these are calculations made across categories without taking any weighting into account. The headline performance takes weighting into account; the weighted core and the headlines are moving in the right direction.
Sequentially, on this broader basis, trends look better. Over 12 months compared to 12 months earlier, inflation is accelerating in only 33.3% of the categories, but then over six months compared to 12 months, the inflation rate is increasing in half of the categories. Over three months, that diffusion measure falls to 41.7%; i.e., only 41.7% of the categories are experiencing accelerating inflation over three months compared to six months. So, these are much better trends when viewed over a broader period. To bring a little bit more life into these abstract diffusion figures, I've also presented the median and average pace of inflation over three months, six months, and 12 months at the bottom of the table. There you can see that the median pace of inflation on this sequence is 3.5% over 12 months and six months, and then it falls to 3% over three months. The average pace of inflation over 12 months is 3.5%; it stays at 3.5% over six months and then decelerates to 2.9% over three months.
Ranking 12-month inflation rates: The final column ranks the current inflation rates across categories and for the headlines on data back to 2000. The HICP measure has a 62.9 percentile standing, the CPIH measure has a 72.5 percentile standing, while this CPIH core has a 79.6 percentile standing. These standings tell us that the inflation rates for these categories are high relative to where they have been since 2000. At the bottom of the table, we can see that the median inflation rate since 2000 has been 2.2%, while the average pace of inflation has been 2.5%. So, over the full, back-to-2000 span, inflation has been slightly north of the BOE target, depending on which measure we look at, the median or the average. The median pace has been quite close, while the average has been half a percentage point too high. A current ranking that puts the inflation rates above their respective medians (and a ranking of 50 represents the median) evaluated the individual category as above its own median at a time when the median and averages overall were already too hot. For all but three of these categories, inflation is still high by a historic experience (above a ranking of 50%). That probably continues to require a somewhat restrictive interest rate from the central bank. Across categories, the highest-ranking inflation is a 91.1 percentile standing for communication, followed by an 84-percentile standing for restaurants & hotels and standings in the 79th percentile for transportation as well as for the core CPI taken as a whole. Inflation rates below their medians for the period back to 2000 are for food & nonalcoholic beverages, furniture, household equipment & maintenance, and healthcare.
 Global| Jul 21 2026
ZEW Shows Mixed Gains in July
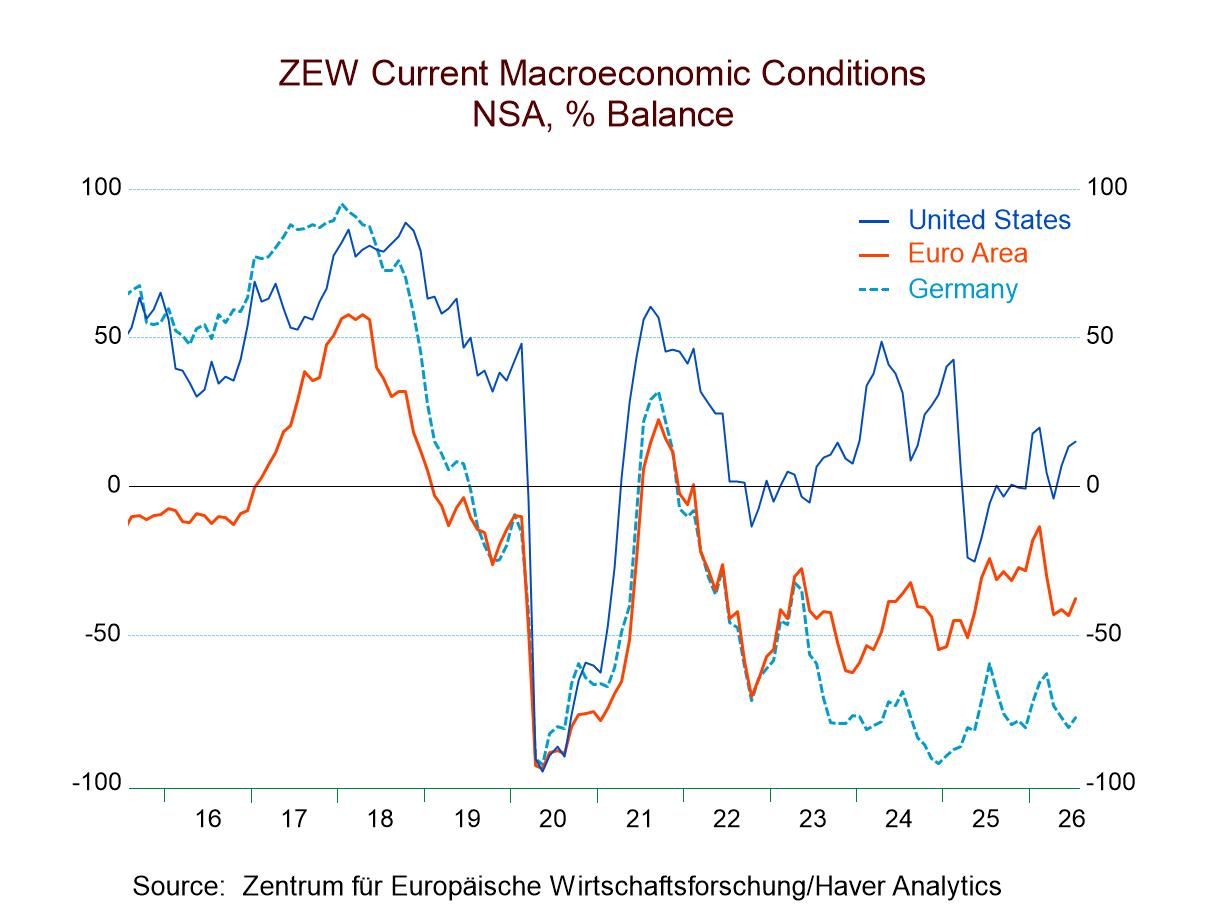
The ZEW survey, assessing the opinions of German financial experts for July, showed continuing weak but improving conditions in the euro area, Germany, and the United States, with a slight step back in China. Economic expectations improved month-to-month for Germany and China, while posting a slight setback in the United States. Inflation expectations weakened month-to-month sharply and significantly across the board in all four economic units. Short-term interest rates are broadly expected to fall, while long-term interest rates are also expected to ease, with the exception of China, where some small increases are anticipated. Stock markets are showing weaker performance, with moderate step backs across all four areas.
The average of the percentile standings for the four economic units surveyed is a standing in the 44th percentile. That average reflects China as the only survey member above its median observation. Germany has the lowest reading at a 17.8 percentile standing. Next, economic expectations have a 44-percentile average as Germany is the only one above its 50th percentile mark, putting it above its median. The U.S. and China show weaker level standings around their respective 40th percentiles. Inflation expectations have a midstream ranking at their 47th percentile, below their historic medians, with China above its historic median, Germany very close to its historic median, and the euro area and the U.S. posting more moderate standings. Short-term rate expectations have an average standing in their 68th percentile; all of the readings are above their 50th percentile mark, marginally so for the U.S. but more substantially for China and the euro area. Long-rate expectations have a 46.4 percentile average standing, with China well above its median on a ranking above the 50th percentile and with rankings between the 35th and 40th percentiles for Germany and the U.S. Stock market expectations average a 36.9 percentile standing for the four economic units, with the U.S. and China above their 50th percentile mark and the euro area and Germany, substantially weaker.
Most notably, inflation expectations fell sharply in July across the board. But that was probably earlier in the month and reflected a belief that the U.S.-Iran ceasefire would hold. Now that is largely reversed as the hot war is back in Iran. So, we will expect to see backtracking in this survey next month. Of course, that means that the interest rate portion of the survey might also be in for a rehash. That will be something to watch for.
 Germany| Jul 20 2026
German PPI Shows Pressure but Backs Off in June
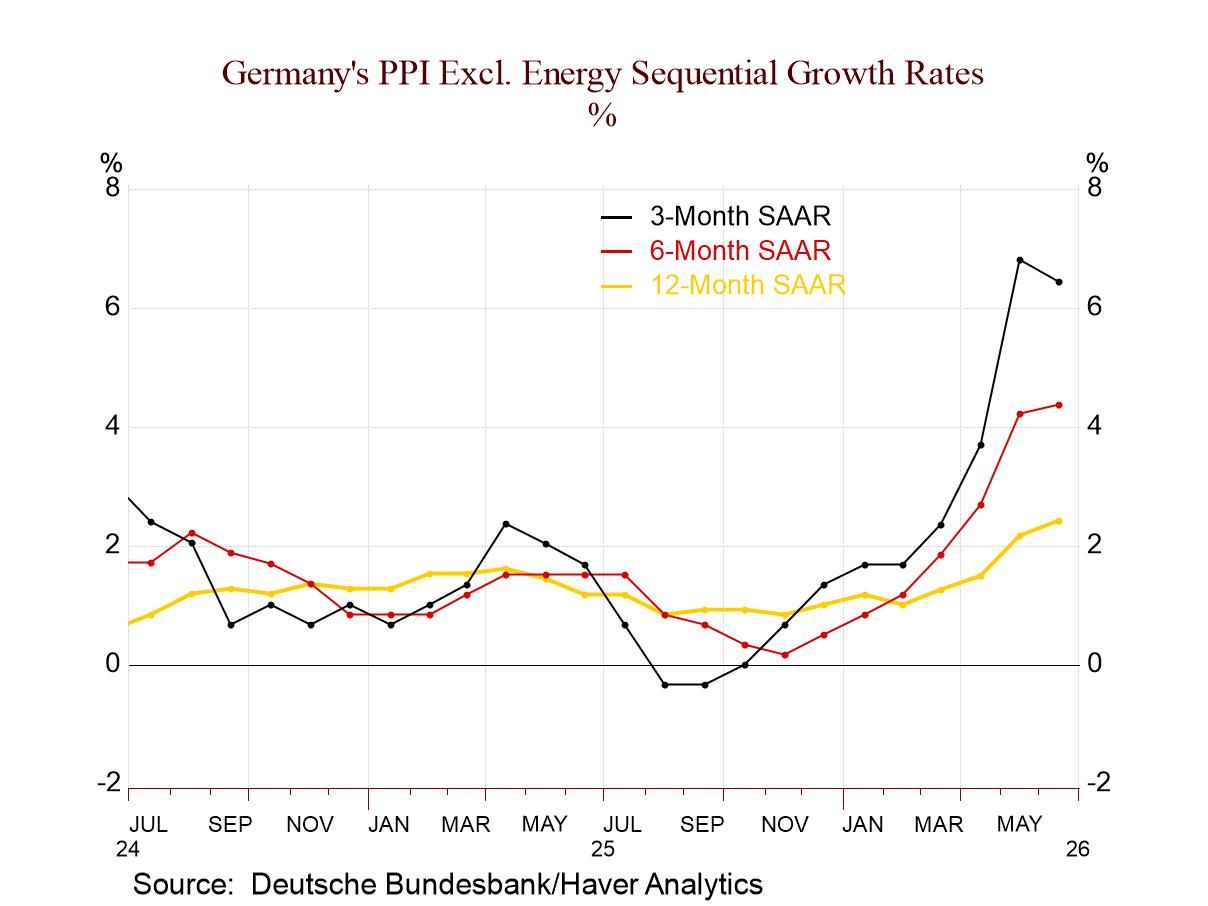
The German PPI excluding construction fell by 0.3% in June following three months of increases. Sequentially, the PPI is accelerating, with a 1.8% rise over 12 months, a gain at a 4.3% annual rate over six months, and a gain at a 4.8% annual rate over three months. They are joined by PPI excluding energy index, which also shows an accelerating pattern, rising 2.4% over 12 months, at a 4.4% annual rate over six months, and then at a 6.4% annual rate over three months.
The inflation picture for in June is fine if you restrict your view to the headline, where it dropped by 0.3%. However, the PPI excluding energy rose by 0.3% in June after rising by 0.7% in May and by 0.5% in April, definitely a string of unruly increases for producer prices in Germany.
Sector trends: The sector inflation metrics are not seasonally adjusted; as a result, a sequential trend may not be as reliable. On the other hand, when data aren't seasonally adjusted, it's often because the statistical authorities haven't detected stable patterns of seasonality and so they present the data as not seasonally adjusted. Let’s look at the sector trends, NSA. For consumer goods, prices fall by 1.7% over 12 months, followed by a 0.2% annualized fall over six months and at a 0.3% annual drop over three months. The pattern is not particularly reassuring as the pace of decline is waning sequentially, although consumer goods are producing declines and showing price weakness. Investment goods, on the other hand, show prices steadily expanding, by 2.1% over 12 months, by 3.2% annually over six months but then stepping back slightly toward a 2.4% annual gain over three months. Not surprisingly, the inflation fire is really cooking under intermediate goods, where raw materials have a bigger role. Intermediate goods prices are up by 5.1% over 12 months; unadjusted prices are up at a 10.9% annual rate over six months and then at a 13.8% annual rate over three months. This is clearly the source of the price pressure in the PPI.
Energy prices: Energy prices are only part of the problem, however, and we can see in the energy prices at the bottom of the table that they are producing some strange and unstable price trends. Brent oil prices measured in euros fell 17% month-to-month in June after rising by 0.8% in May and by 1.6% in April. Sequentially, Brent prices are up by 20.2% over 12 months and up at a 94.1% annual rate over six months, but then they fall to a 47.6% annual rate over three months. Against that background, prices in the second quarter compared to the first quarter show an increase at a 141.3% annual rate. These metrics explain why it's hard to pin down the oil-price impact on the PPI. The quarter-to-quarter changes are enormous, the three-month change is extremely weak, but that follows an extraordinary annualized gain over six months, and in June alone oil prices fell sharply by 17%. It is hard to keep track of the oil-price passthrough cycle. So, we're going to have to wait for these trends to sort themselves out to get a better fix on the impact of oil and energy prices. However, we know that the recent good news on oil has since been rescinded as the Strait of Hormuz, which was briefly open, is shut again and the U.S. and Iran have scrapped their fledgling ceasefire agreement.
Euro area—what matters: Policy in the euro area is made based upon inflation for the whole union, not just for Germany, but it pays closer attention to the CPI than the PPI. Germany is still the largest economy in the monetary union, and its CPI is up 2.3% over 12 months, up at a 2.5% annual rate over six months, and rising at a 0.3% annual rate over three months. The CPI excluding energy for Germany is considerably more stable, up by 2.3% over 12 months and then rising at a 2% annual rate over both six months and three months. German ex-energy CPI prices appear to be calm, with inflation arrested; however, we can't say the same thing for the PPI ex-energy, with the inflation rate in a clear accelerating mode.
- of8Go to 3 page