 Global
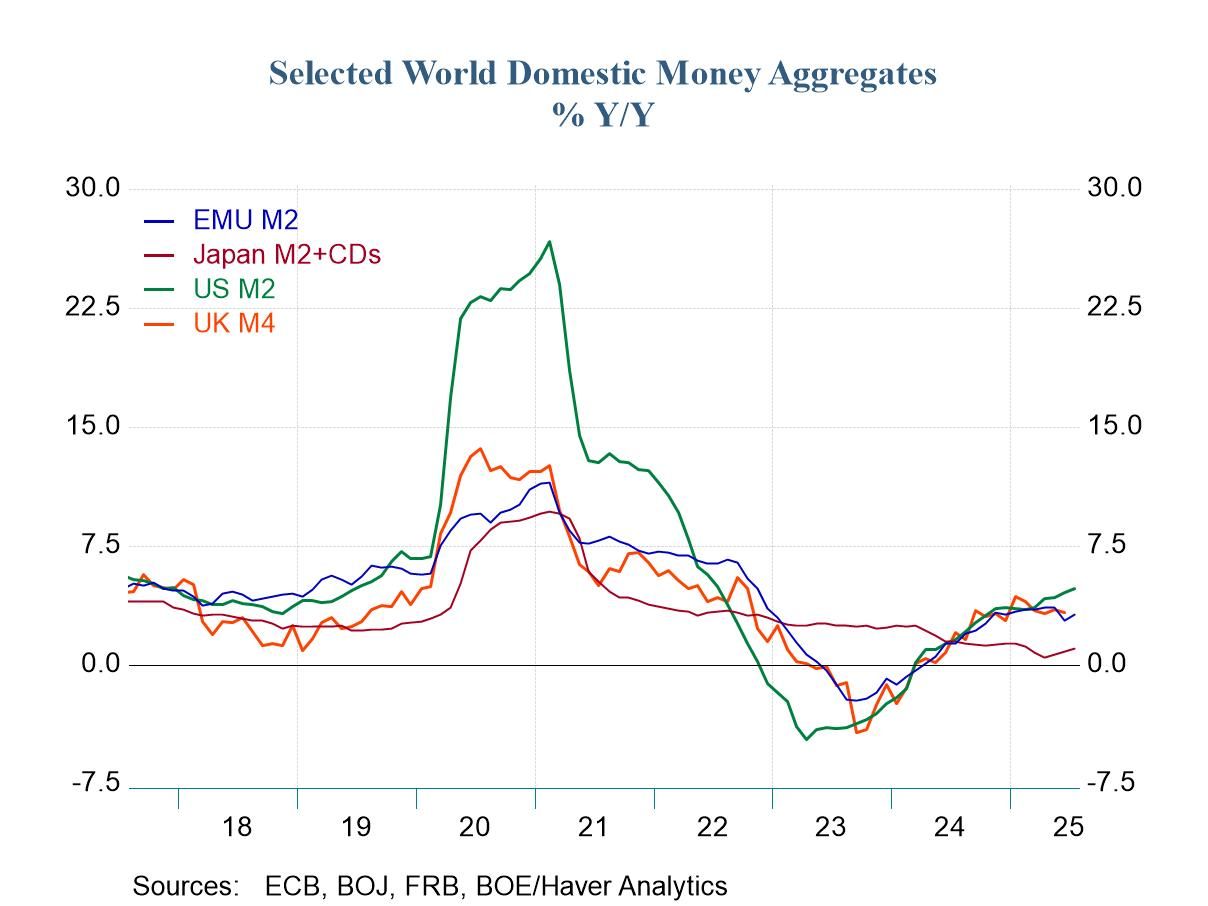
Japan is a clear exception going, it alone on its money growth path. The United States, the United Kingdom, and the European Monetary Union have largely seen their money growth aggregates coordinated for annual growth in recent years. Money growth generally bottomed in 2023 with growth actually negative during part of that year. However, into 2024 money growth began to accelerate and it achieved positive growth. By the end of 2024, money growth rates had been restored to a moderate pace and money growth in the U.S., the U.K. and the European Monetary Union had mostly stabilized. However, in the last few months money growth in the U.S. has been accelerating. Money growth in the U.K. and the European Monetary Union has stabilized or weakened slightly. Money growth in Japan during all of this, has tended to decelerate marginally and now, in 2025, there is the slightest pickup in money growth in Japan to a still very weak pace.
Nominal money In the European Monetary Union, M2 growth has been at 1.1% over 3 years, 2.2% over 2 years and 3.2% over 1 year. Over shorter periods, six-months growth decelerated to 1.9% and over three months it decelerated further to about 1%, all at annual rates. Credit growth in the EMU has decelerated as well with private credit a little over 2% over six months and over 12 months, and the falling back to a 1.4% annual rate over three months.
The U.S. money growth progressed from 0.7% over 3 years, then 3.2% over 2 years, to 4.8% over 12 months. It moved up to 5.7% at an annual rate over six months and then moved up further to 5.8% at an annual rate over three months as nominal money growth continues to accelerate.
In the United Kingdom, money growth accelerated from 3-years to 2-years to 12-months from 1.3% to 2% to 3.3%. However, moving on to 6 months, U.K. money growth accelerated to 4.6% and then decelerated, downshifting to a 1.6% pace over 3 months complicating its true path.
In Japan, M2 plus CDs showed weak growth of 1.7% over 3 years, 1.2% over 2 years, and 1% over 12 months; over 6 months the annual growth rate sank to 0.3%, but over 3 months it has picked up to a 2.5% annual rate.
Real money balances Turning to real money balances, we find negative growth rates for money supply over 2 years and 3 years for the European Monetary Union, the U.K., and Japan. In addition, private credit growth in real terms in the EMU is negative over 2 years and 3 years. In the U.S., real money growth is -2.2% over 3 years, moving up to 0.3% over 2-years and then to 2% over 12 months.
The U.S. continues to be an exception with 6-month real money balances at a 3.7% annual rate and at a 3.5% annual rate over 3 months. In the EMU, real money balances are only growing 0.2% over 6 months and then fall back to drop at a 1.9% at an annual rate over 3 months. In the U.K., real money balances grow by 0.3% over 6 months and then fall 2.6% at an annual rate over 3 months. In Japan, real money balances decline 1.3% over 6 months and grow 0.4% over 3 months as money growth in Japan begins to stabilize slightly in real terms over 3 months.