U.S. Advance Durable Goods Orders Dragged Down Again by Aircraft in July
by:Sandy Batten
|in:Economy in Brief
Summary
- Durable goods orders fell 2.8% m/m in July on top of a 9.4% monthly drop in June.
- Once again, weak nondefense aircraft orders were the key factor; nondefense aircraft orders plunged 33% m/m in July on top of a 53% m/m decline in June.
- In contrast, orders excluding transportation rose a solid 1.1% m/m in July, their largest monthly gain since September 2024.
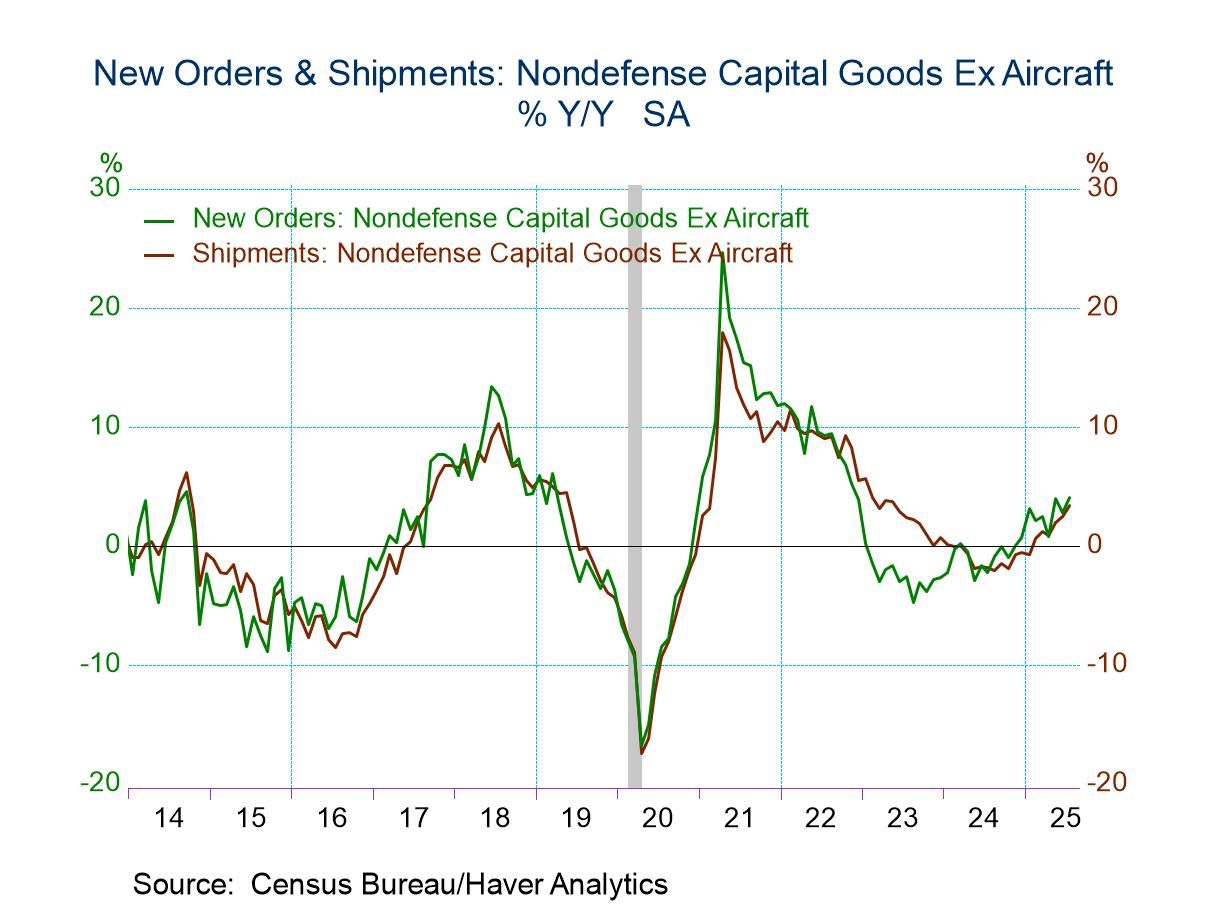
- Core capital goods orders rebounded, and shipments posted a solid gain.
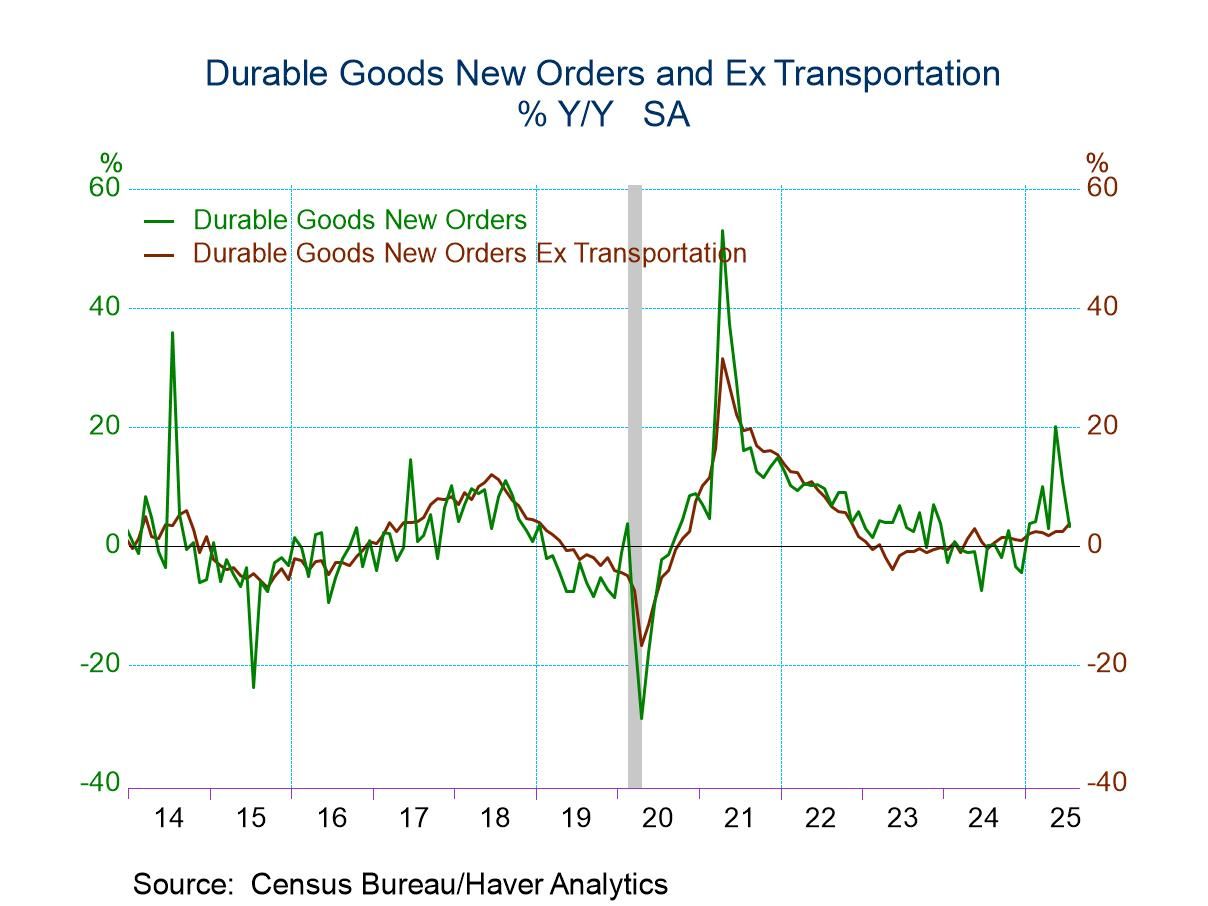
Durable goods orders fell 2.8% m/m (+3.3% y/y) in July on top of a slightly downwardly revised 9.4% monthly decline in June (previous -9.3% m/m). A 4.0% m/m decline had been expected by the Action Economics Forecast Survey. Once again, plummeting nondefense aircraft orders were the key factor behind the overall decline in July. Excluding nondefense aircraft orders, the remaining orders rose 0.2% m/m in July after a 0.3% m/m decline in June.
Orders excluding transportation increased by a solid 1.1% m/m (+3.8% y/y) in July following a 0.3% monthly gain in June. The July monthly increase matched the September 2024 gain as the largest in more than two years. Orders for nondefense aircraft plunged 32.7% m/m in July, on top of a 52.7% monthly decline in June. Apart from the plunge in aircraft orders, orders in other major groups posted solid increases. Orders for motor vehicles increased 0.3%, their third consecutive monthly gain. Orders for primary metals jumped 1.5% m/m, the largest monthly gain since April 2024. Fabricated metals orders rose 0.7% m/m after a 0.1% monthly decline in June. Machinery orders soared 1.8% m/m, the largest monthly increase since January. Orders for computers and electronic equipment increased 0.6% m/m. Orders for electrical equipment and appliances jumped 2.0% m/m, the largest increase since last December.
The capital spending data in this report augured a solid beginning for Q3 business spending on equipment. Shipments of core capital goods (nondefense capital goods shipments excluding aircraft) are a reliable coincident indicator of business spending on equipment in the national accounts. They increased 0.7% m/m in July, the largest monthly gain since April 2023, and are up more than 4% annualized in July from the Q2 average. Moreover, core capital goods orders rebounded in July, jumping 1.1% m/m after a 0.6% monthly decline in June.
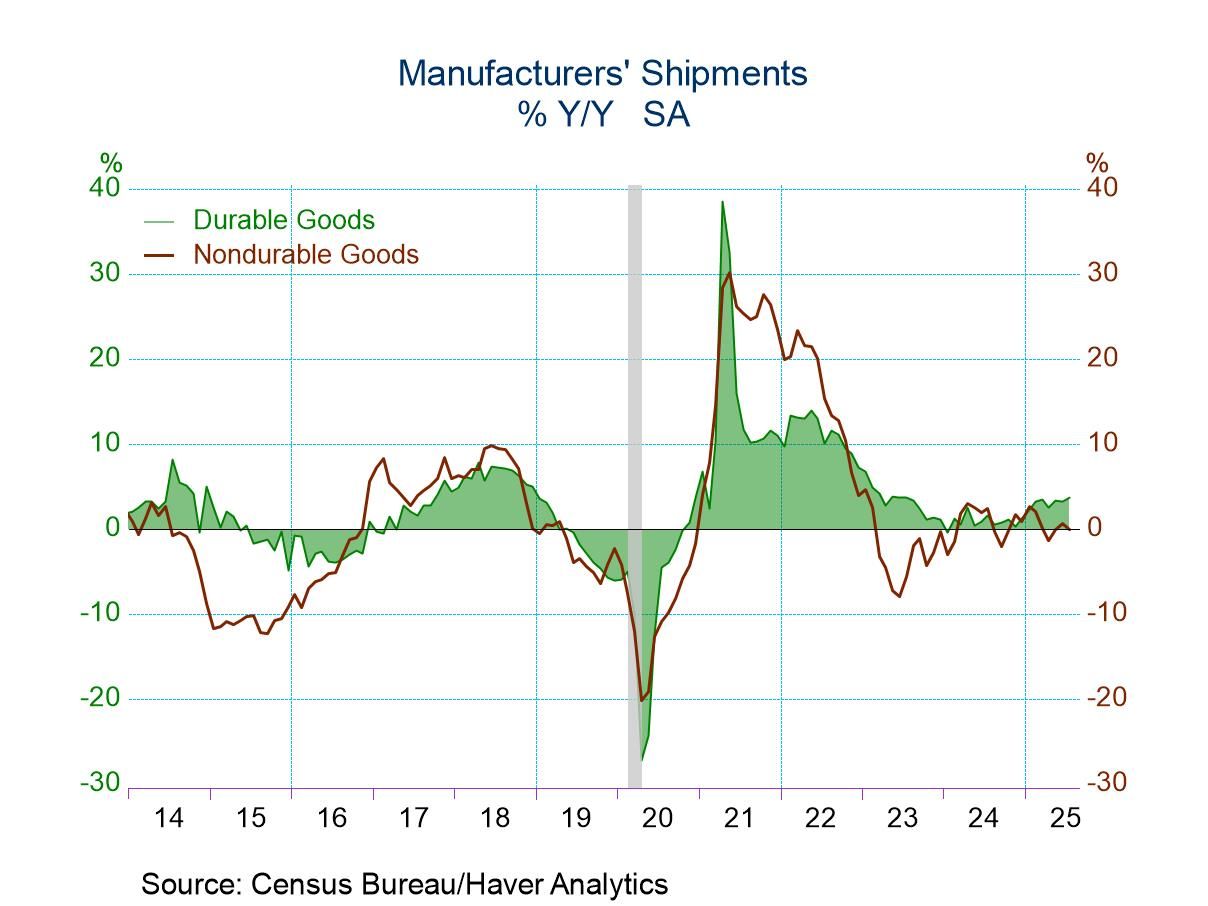
Total manufacturing shipments increased 0.8% m/m (+1.8% y/y) in July following a 0.6% monthly increase in June. Shipments of durable goods rose a solid 1.4% m/m (+3.6% y/y), the largest monthly gain since May 2023. Excluding shipments of transportation goods, remaining shipments increased 1.0% m/m in July, the largest monthly increase since January 2023. Gains were widespread across major sectors with each one reporting an increase in July. Transportation shipments rose 2.3% m/m, led by a 15.5% monthly jump in shipments of nondefense aircraft and parts. Shipments of computers rose 4.5% m/m, their first monthly gain in three months. Shipments of nondurable goods edged up 0.2% m/m (-0.1% y/y), their third consecutive monthly increase.
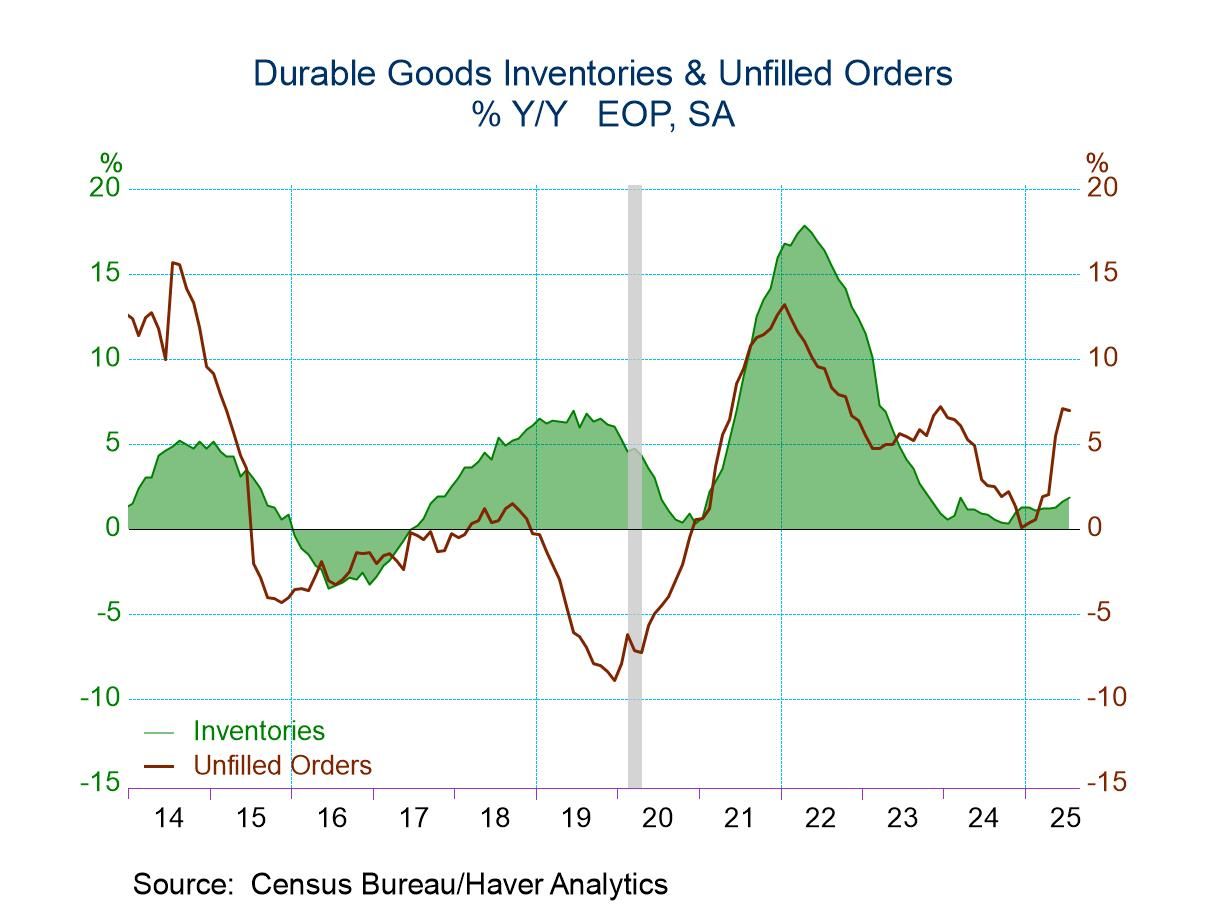
Unfilled durable goods orders were unchanged in July from June (+7.0% y/y). Inventories of all manufactured goods increased 0.3% m/m in July (+1.4% y/y), the largest monthly gain since last December. Inventories of durable goods rose 0.3% m/m (+1.8% y/y), their fifth consecutive monthly increase. Motor vehicle inventories jumped 0.8% m/m, their largest monthly increase since October 2023. Aircraft inventories slipped 0.2% m/m, their third consecutive monthly decline. Inventories of nondurable goods increased 0.2% m/m in July (+0.8% y/y), the same monthly gain as in June.
The factory sector data are available in Haver’s USECON database. The Action Economics Forecast Survey is in the AS1REPNA database.

Sandy Batten
AuthorMore in Author Profile »Sandy Batten has more than 30 years of experience analyzing industrial economies and financial markets and a wide range of experience across the financial services sector, government, and academia. Before joining Haver Analytics, Sandy was a Vice President and Senior Economist at Citibank; Senior Credit Market Analyst at CDC Investment Management, Managing Director at Bear Stearns, and Executive Director at JPMorgan. In 2008, Sandy was named the most accurate US forecaster by the National Association for Business Economics. He is a member of the New York Forecasters Club, NABE, and the American Economic Association. Prior to his time in the financial services sector, Sandy was a Research Officer at the Federal Reserve Bank of St. Louis, Senior Staff Economist on the President’s Council of Economic Advisors, Deputy Assistant Secretary for Economic Policy at the US Treasury, and Economist at the International Monetary Fund. Sandy has taught economics at St. Louis University, Denison University, and Muskingun College. He has published numerous peer-reviewed articles in a wide range of academic publications. He has a B.A. in economics from the University of Richmond and a M.A. and Ph.D. in economics from The Ohio State University.


 Global