

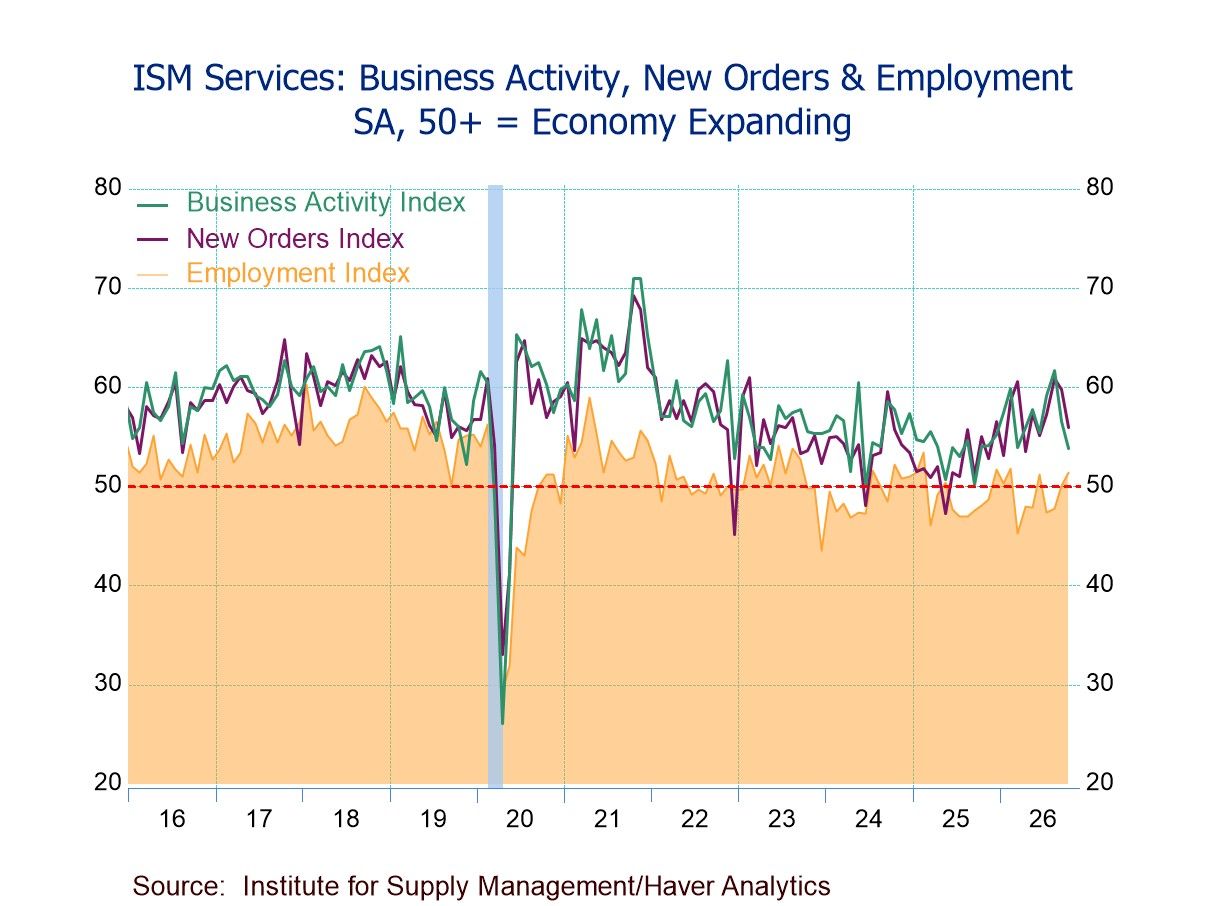
- ISM Services PMI down slightly to 54.5 in Oct., still above the 12-month avg. of 54.3.
- Business Activity (53.8) lowest since Sept. ’25; expanding for the 28th consecutive mth.
- New Orders (55.9) lowest since June; growing for 17 mths. running.
- Employment (51.4) highest since February; second successive mth. above 50.
- Prices Index (73.0) down modestly but above 70 for the seventh time in eight mths., indicating prices rising since June ’17.
 USA| Nov 04 2026
U.S. ISM Services PMI at a Three-Month Low, Still Indicating Expansion for the 28th Straight Month
 USA| Nov 04 2026
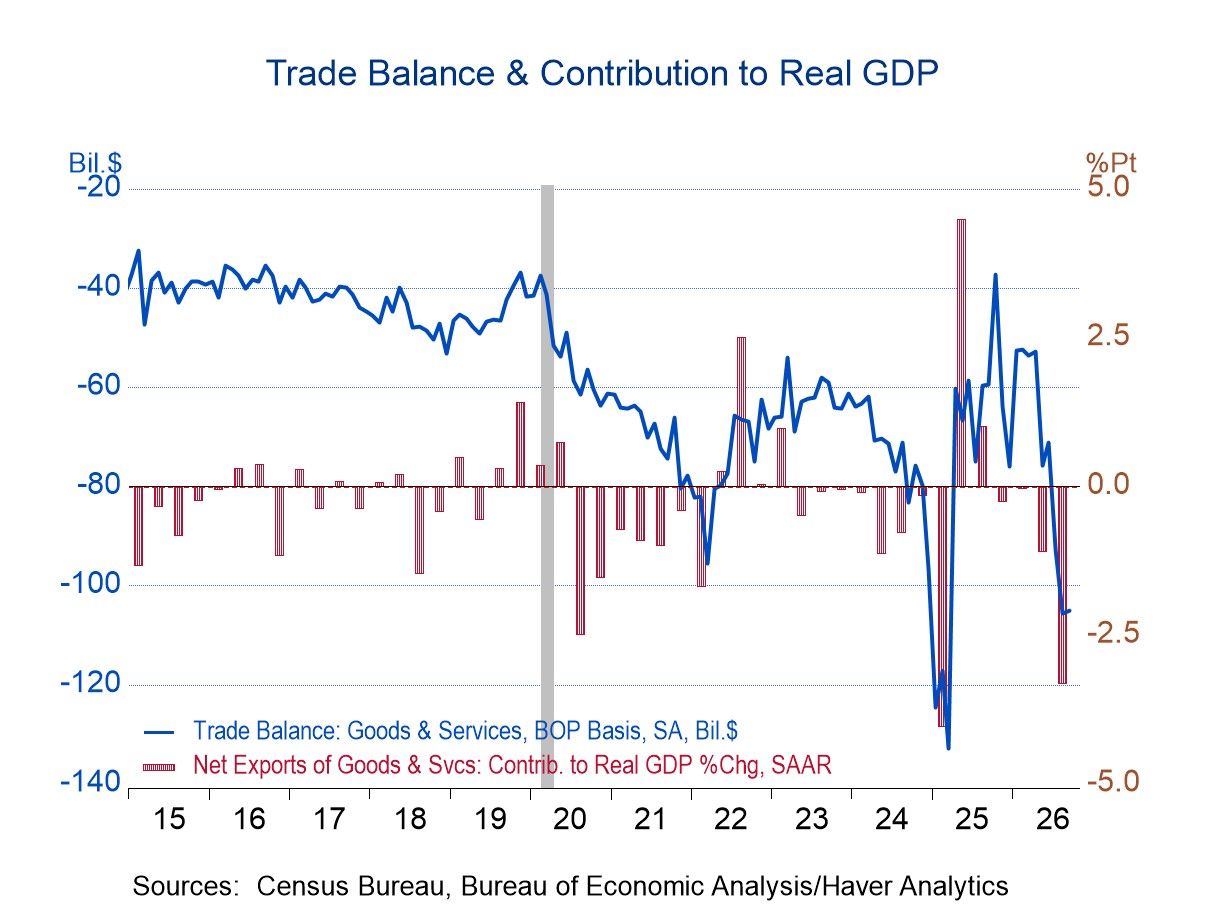
U.S. Trade Deficit Narrowed Slightly in September
- The deficit in goods and services narrowed to $105.0 billion in September from $105.7 billion in August.
- This capped off a quarter in which the trade deficit widened markedly, subtracting 3.3%-points from overall GDP.
- The goods deficit narrowed to $135.9 billion in September, while the services surplus was essentially unchanged at $30.9 billion.
- Exports rose 1.9% m/m, led by strong increases in exports of food and feeds and of capital goods.
- Imports increased by 1.2% m/m, once again dominated by increased AI-related capital goods imports.
by:Sandy Batten
|in:Economy in Brief
 USA| Nov 04 2026
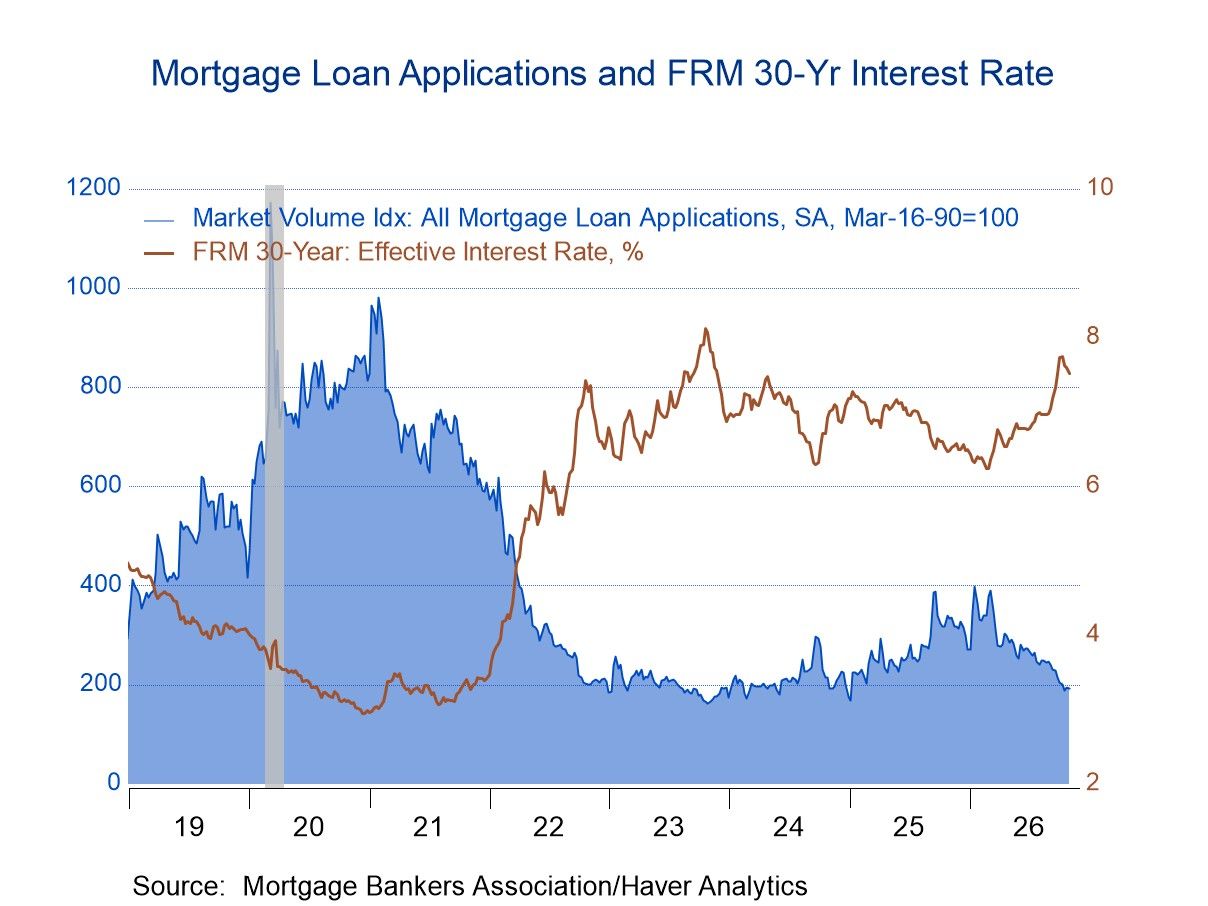
U.S. Mortgage Applications Fell in the October 30 Week
- Applications for loans to purchase declined and applications for loan refinancing edged up in the latest week.
- Interest rate on 30-year fixed-rate loans fell 7bps to 7.52%.
- Average loan size edged down in the October 30 week.
 Global| Nov 04 2026
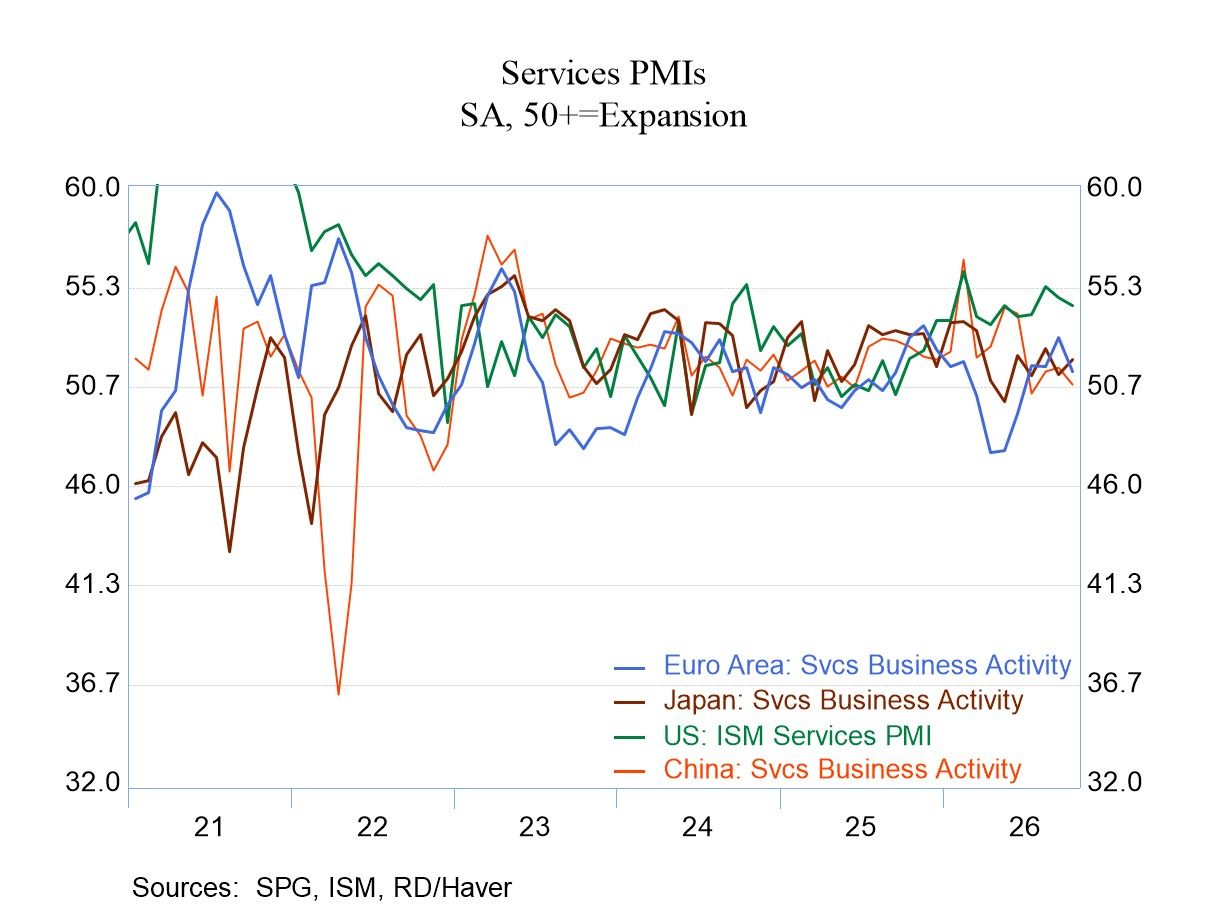
Composite Global PMIs Lose Breadth but Not Much Strength
The S&P Global PMI data for October show a very broad worsening, with only 6 of 25 reporting countries logging month-to-month improvement. However, the average PMI reading for the total PMIs on an unweighted basis in October yields a value of 52.1 compared to 52.8 in September, a modest drop for such broad weakening. The group median, however, was unchanged at 52.3 in October compared to 52.3 in September. The number of jurisdictions contracting in October rose to 7 from 5 in September, back to where it was in August and back to its six-month average for the number of reporters contracting.
There is no single number that can adequately pin down exactly how this diverse group of countries is performing; no single metric can characterize the global economy adequately. However, we can see from the various metrics that there's a good deal of irregularity, and the deterioration itself may not have been large. There's a fairly broad-based deterioration that occurred from September to October. Even so, the average reading in October is slightly below the three-month average of 52.4, which is stronger than its six-month and 12-month readings for the pooled group average. The group median, at 52.3, is nearly the same as the 52.4 reading for the last three months, which is a reading above its six-month and 12-month values. In short, there appears to be some mixing around and oscillation of the performance metrics by some of the reporting countries, but not so clear erosion.
The average reading for the group consisting of the United States, the United Kingdom, and the European Monetary Union shows 52.1 for the 12-month average, 52.4 for the six-month average, and then a rise to 53.9 for the three-month average. The October reading for this group at 53.6 is below the three-month average. But the October reading is still above the six-month and 12-month averages.
The shaded areas in the table identify periods when the readings are below 50, indicating a decline in activity in PMI terms. There are five reporting areas that have this characteristic over three months, six months, and 12 months. They are France, Brazil, Zambia, Egypt, and Qatar.
Despite various degrees of improving or deteriorating, there are 17 reporters that record total PMI values above 50 over three months, six months, and 12 months. And there are 16 that show expansion over each of the last three months. Growth rules.
At least growth has been the rule. It's not clear that there's been a lot of strength. To assess strength, we look at the queue percentile standings that rank the current October readings against all previous values back to January 2021. Queue percentile standings have an average value of 52.1% and a median of 48%. The average is about two percentile points above the neutral diffusion reading of 50, while the median across these reporters is about two percentile points below the neutral reading, indicating no change in output. There are 11 reporters with queue standings below their 50th percentile, putting them below their medians for the period. Among the weakest reporters are Qatar at a 4.3% standing and Brazil at a 7.2% standing; Australia and Zambia have standings at their respective 17th percentiles. That leaves 14 countries above their 50% mark and, therefore, above their historic medians. Only two countries log standings in their 90th percentiles, Kenya and Nigeria. Other than these two, the highest standings are in the 70th percentile, such as the U.S. (at a 79.7 percentile), Spain, Germany, Singapore, and Japan. The more advanced countries have standings at higher percentile markers; however, France and Italy are exceptions with readings that are in their respective 30th percentiles.
 USA| Nov 03 2026
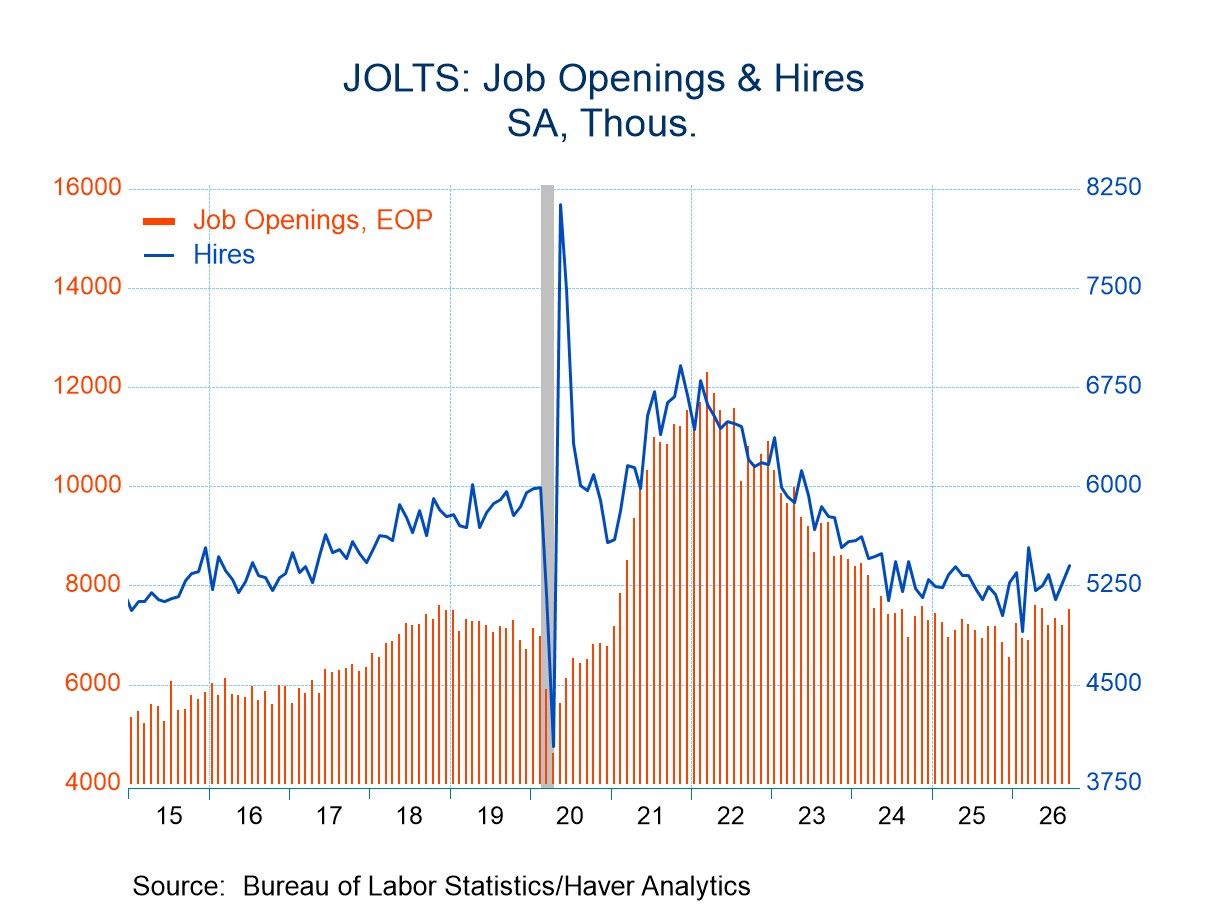
U.S. JOLTS: Labor Demand Improved in September
- Large industry gains drove September increases in job openings and hires.
- Quits jump ran counter to alternative job leavers.
- Hires-Separations point to mixed nonfarm payroll revisions.
 USA| Nov 03 2026
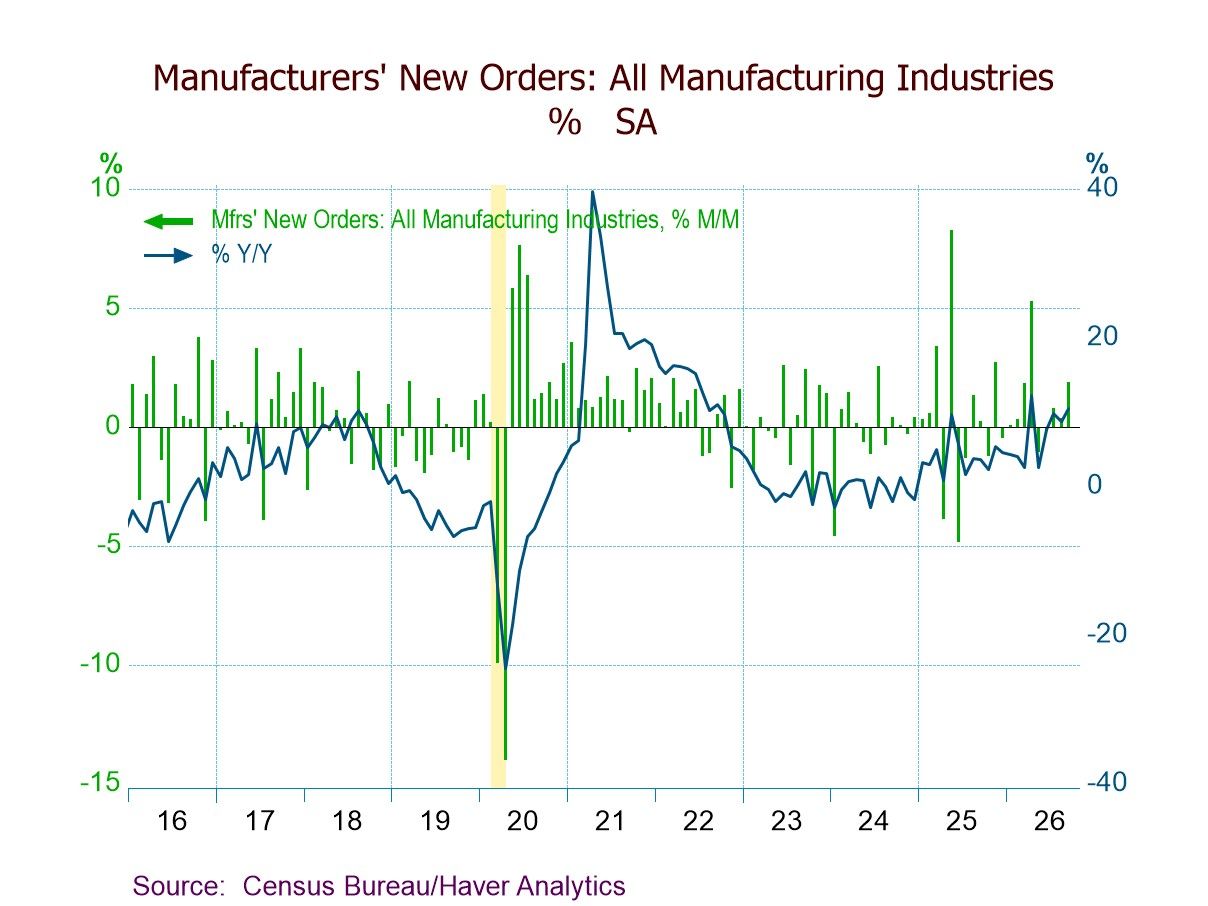
U.S. Factory Orders Up More Than Expected in September on Strong Nondefense Aircraft Orders
- Factory orders +1.8% (+10.5% y/y) in Sept., third straight m/m rise; 17.6% above the Jan. ’24 low.
- Durable goods orders +1.9%, fourth consecutive m/m increase; nondurable goods orders +1.8% and shipments +1.3%, ninth m/m gains in 10 mths.
- Transportation orders +4.6%, led by a 28.3% jump in nondefense aircraft orders.
- Unfilled orders +0.9%, up for the 14th month running.
- Inventories +0.4%, 11th successive m/m increase.
 Switzerland| Nov 03 2026
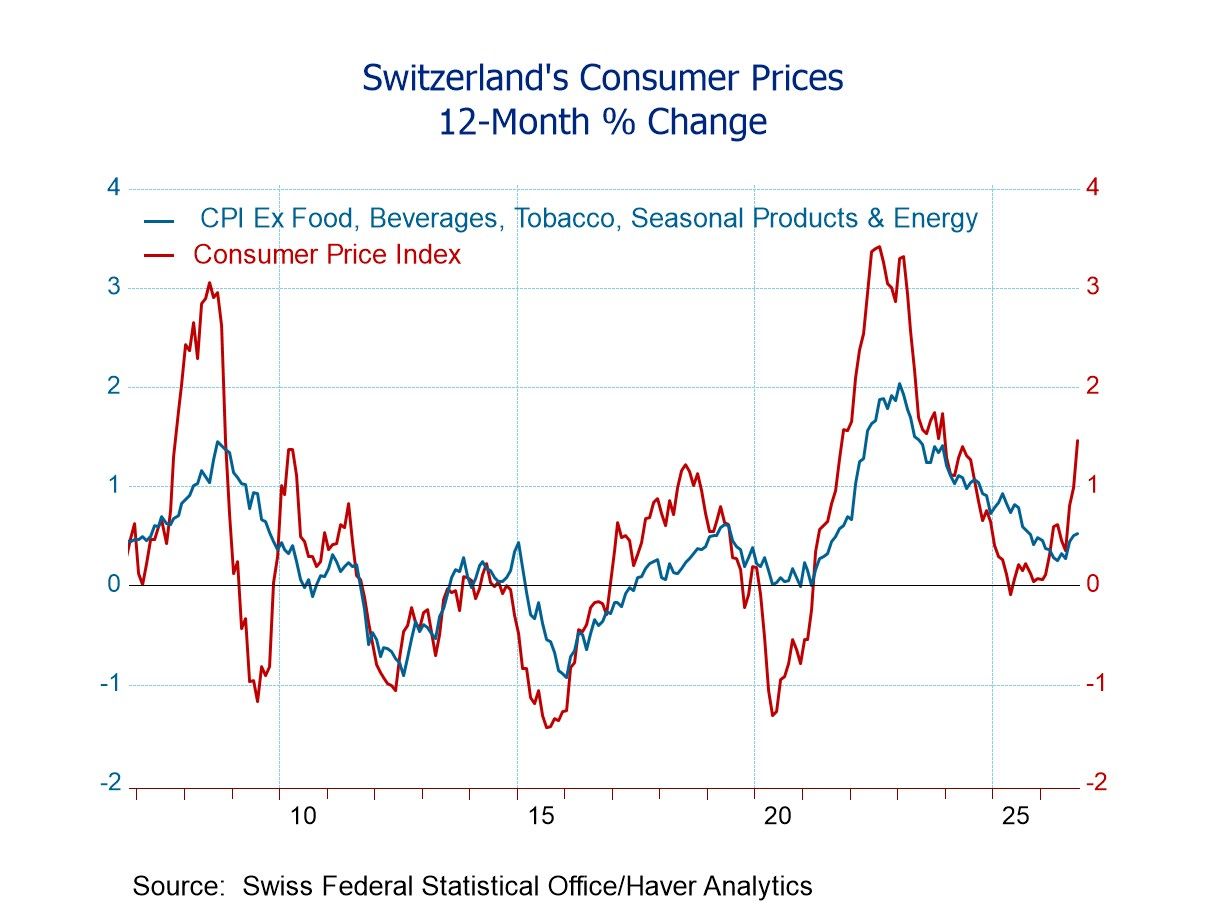
Even Swiss Inflation Heads North
The Swiss inflation rate is the envy of every central banker in the G7 and beyond. Yet, Swiss inflation has turned north in October, with the headline HICP rate gaining 0.4% in October, the Swiss domestic headline metric rising by 0.4% on the month, and the Swiss domestic core inflation rate remaining flat at a 0% change on the month.
Inflation breadth is gaining In October, Swiss inflation showed acceleration in 72.7% of the categories, a sharp increase from September when inflation accelerated in only 18.2% of the categories. However, in August, inflation month-to-month had accelerated in 81.8% of the categories.
Pressure is evident in all measures Switzerland is dealing with real inflation pressures. The 12-month inflation rate has hit a recent high at 1.6%, still an enviably low pace on the HICP measure. The Swiss domestic headline inflation rate is at 1.5%, while the Swiss core rate continues to be mild at a 0.5% increase over 12 months.
Acceleration is also real Turning to the sequential numbers, the HICP inflation rate moves up from 1.6% over 12 months to a 2.1% annual rate over six months to a 3.6% annual rate over three months, a clear pattern of acceleration. The Swiss domestic headline inflation rate is at 1.5% over 12 months, moves up to 1.9% over six months, and elevates to a 3.9% annual rate over three months. The Swiss core inflation rate, which is only 0.5% over 12 months, rises to 0.8% over six months and to 1% over three months, all expressed at annual rates.
Controlling for administered prices A lot of prices in Switzerland face administrative conditions, and there is a separate index for prices excluding administered prices. However, those also show inflation is moving up in October. The index excluding administered prices rose by 0.2% in October after rising 0.1% in September. The sequential move in the index excluding administered prices is up by 0.9% over 12 months; it’s up to a 1.3% annual rate over six months and to 1.6% at an annual rate over three months.
Broad acceleration identified by diffusion gauges Looking at the detailed Swiss categories, inflation accelerates in 81.8% of the categories over three months compared to six months, and in 54.5% of the categories over six months compared to 12 months. Then, 72.7% of the categories over 12 months show acceleration compared to the pace of 12 months ago. Inflation, on all these horizons, clearly is accelerating in more categories than it is decelerating. The tendency for acceleration appears to be moving higher based on the three-month diffusion reading of 81.8%.
 USA| Nov 02 2026
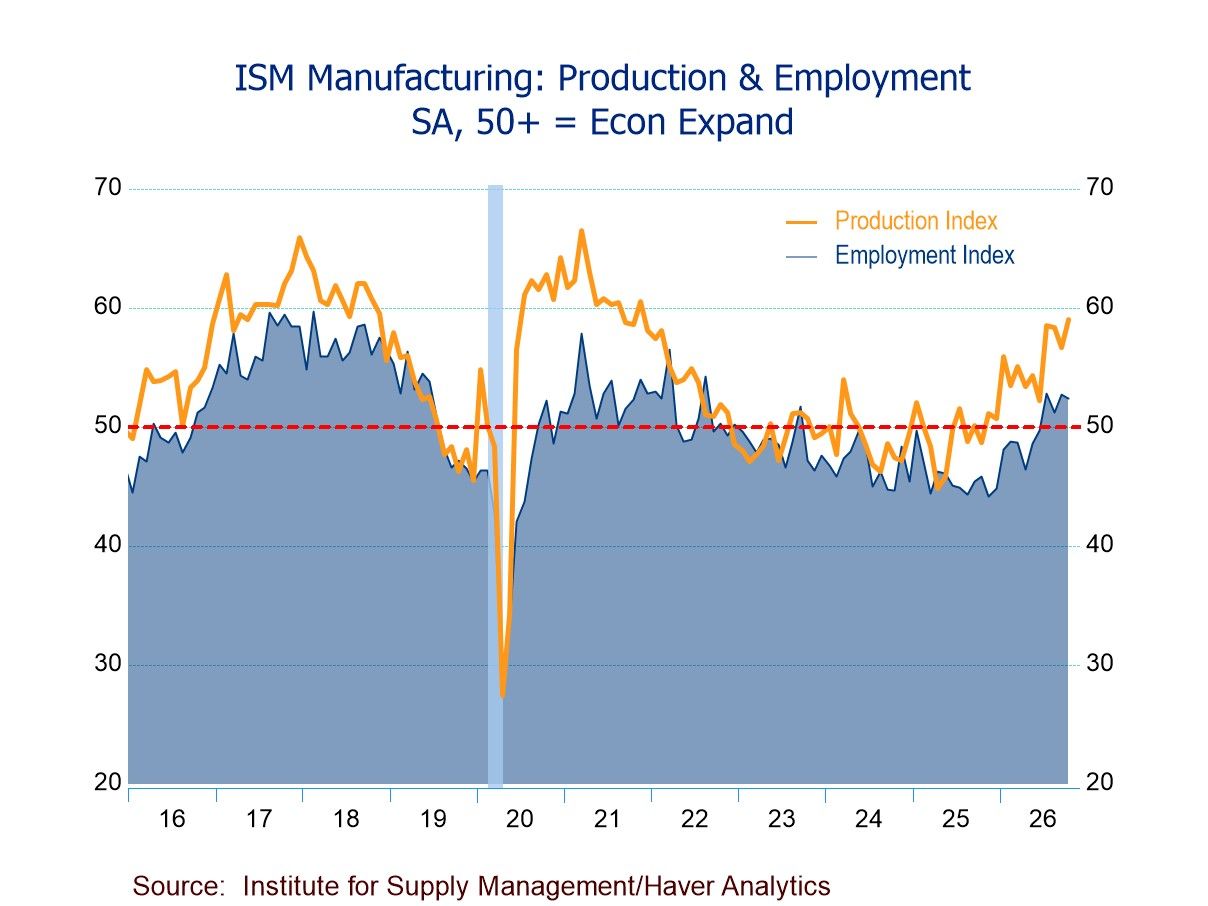
U.S. ISM Manufacturing PMI at a Three-Month High in October; Production & New Orders Accelerating; Employment Moderating
- ISM Mfg. PMI up to 55.5 in Oct.; 10th straight month of expansion.
- Production (59.0) highest since Nov. ’21; expanding for the 12th consecutive mth.
- New orders (55.5) highest since July; 10th successive mth. above 50.
- Employment (52.4) expanding for the fourth straight mth., albeit at a slower rate.
- Prices Index (75.2) down modestly, still indicating prices rising for 25 mths. running.
- Exports (51.2) up and imports (52.9) at a three-month high; both expanding.
- of3Go to 2 page