

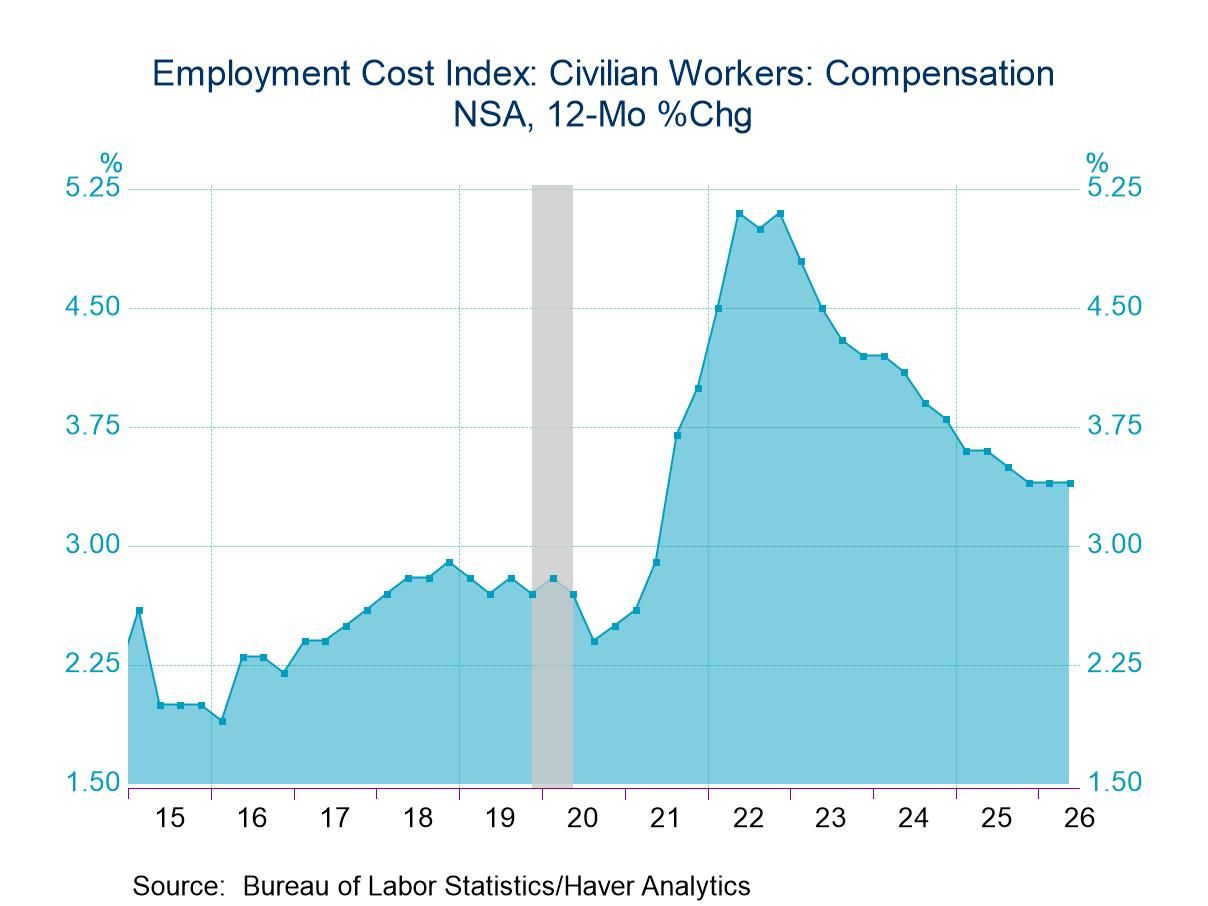
- Compensation growth was steady.
- But faster benefit growth is not favorable for profits.
- Slower wage growth is employers' reaction.
 Europe| Jul 31 2026
EMU HICP Flares After Sag
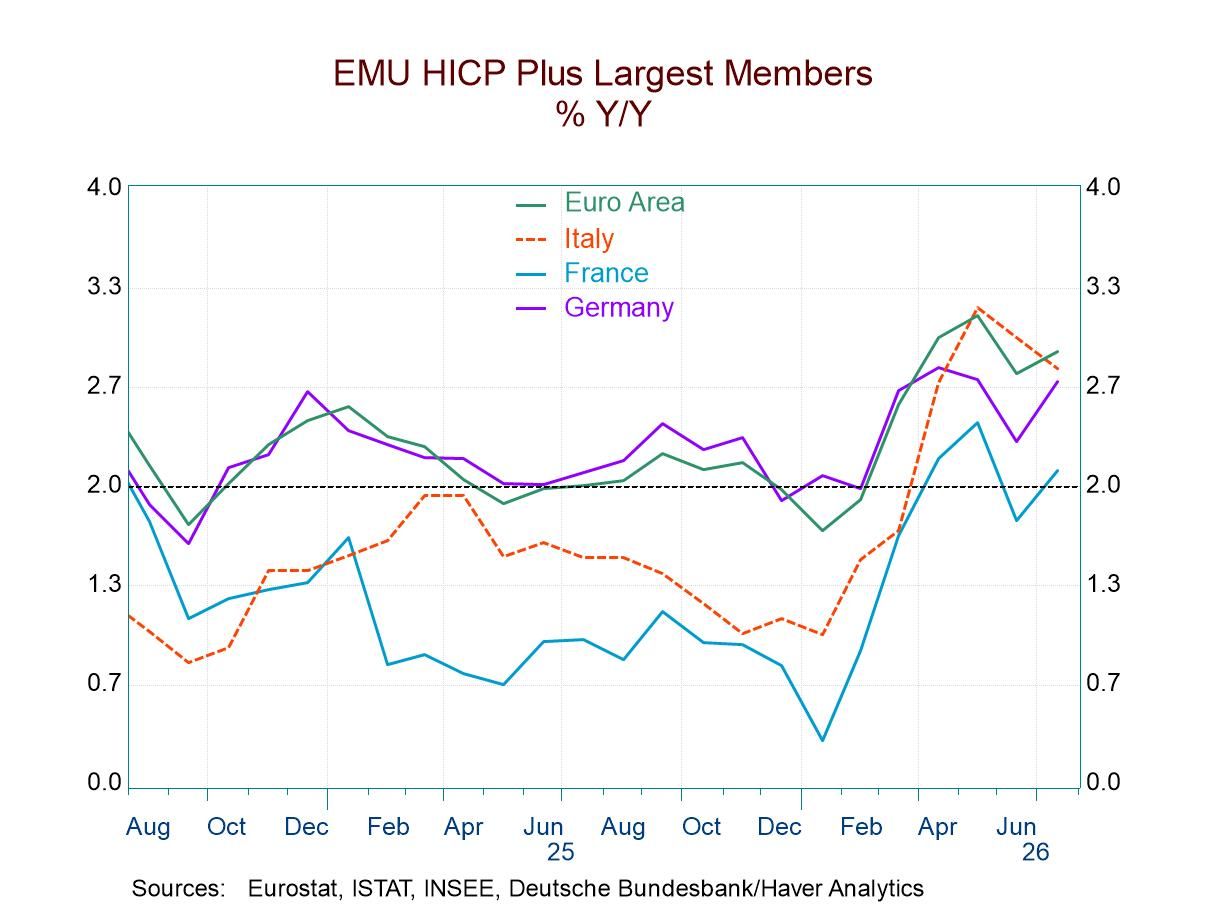
The harmonized index of consumer prices (HICP) for the European Monetary Union (EMU) surged in July, rising by 0.5% after having sagged in June with a -0.1% month-to-month change. The ceasefire that had temporarily been arranged with Iran in June has given way to the reality of ongoing war and ongoing strikes against tanker traffic. While there are some ongoing talks among the combatants, there is not a lot of hope for another ceasefire that's going to last. Both the United States and Iran have their own particular needs to have a ceasefire. But Iran took the last ceasefire as an opportunity to rebuild, recalibrate, apparently strengthen its military capabilities, and then extend its demands for control of the Strait of Hormuz. These were all nonstarters from the U.S. perspective, and I presume from a global perspective as well. The conditions necessary to underpin a ceasefire with some staying power simply do not exist anymore. The U.S. has resorted to hitting Iran harder.
As a result, energy prices have moved back up and inflation in July moved back up in the EMU. Inflation shows a 2.9% rise over 12 months, a 4.1% annual rate of increase over six months, and a 2.6% annual rate of increase over three months. All of these are excessive with respect to the ECB objectives.
Over six months inflation is excessive in the EMU and in its four largest economies: Germany, France, Italy, and Spain. The best (the lowest) inflation performance is in Germany at 3%, while the worst inflation performance is in Italy at 5.2%. These four countries all exceed the ECB’s desired pace of 2% over 12 months as well. Twelve-month Spanish inflation runs at 3.8%, while in France inflation nails down the low side at 2.3%. Over three months, conditions are more varied because we're mixing in this one-month period of very good inflation news with two months of not so good inflation news. Over three months, Spain still logs a 4.4% increase in its HICP at an annual rate, but France logs 1.2% and Italy logs 1.6%; Germany's pace comes in at 2.8%.
We have core inflation or inflation excluding energy metrics (ex-energy in the case of Germany) for three of the four large countries. These metrics for July ranged from a 0.2% increase month-to-month in Germany to a 0.4% increase in core inflation in Italy. The ex-energy or core measures are within reach of the ECB’s target when applied to the core on a country basis. For Germany, the pace is 2.2% over 12 months, on the low side; for Italy, it’s at 1.6%. But excessive inflation persists for Spain where the core measure is at 3%. Over six months, results are highly similar to what we see over 12 months, but over three months we see German inflation at 2.3%, Italy at 2.4%, and Spain at 3.1%. All of these core or ex-energy measures become uncomfortable over three months.
 Global| Jul 30 2026
Charts of the Week: The Price of an Investment Boom
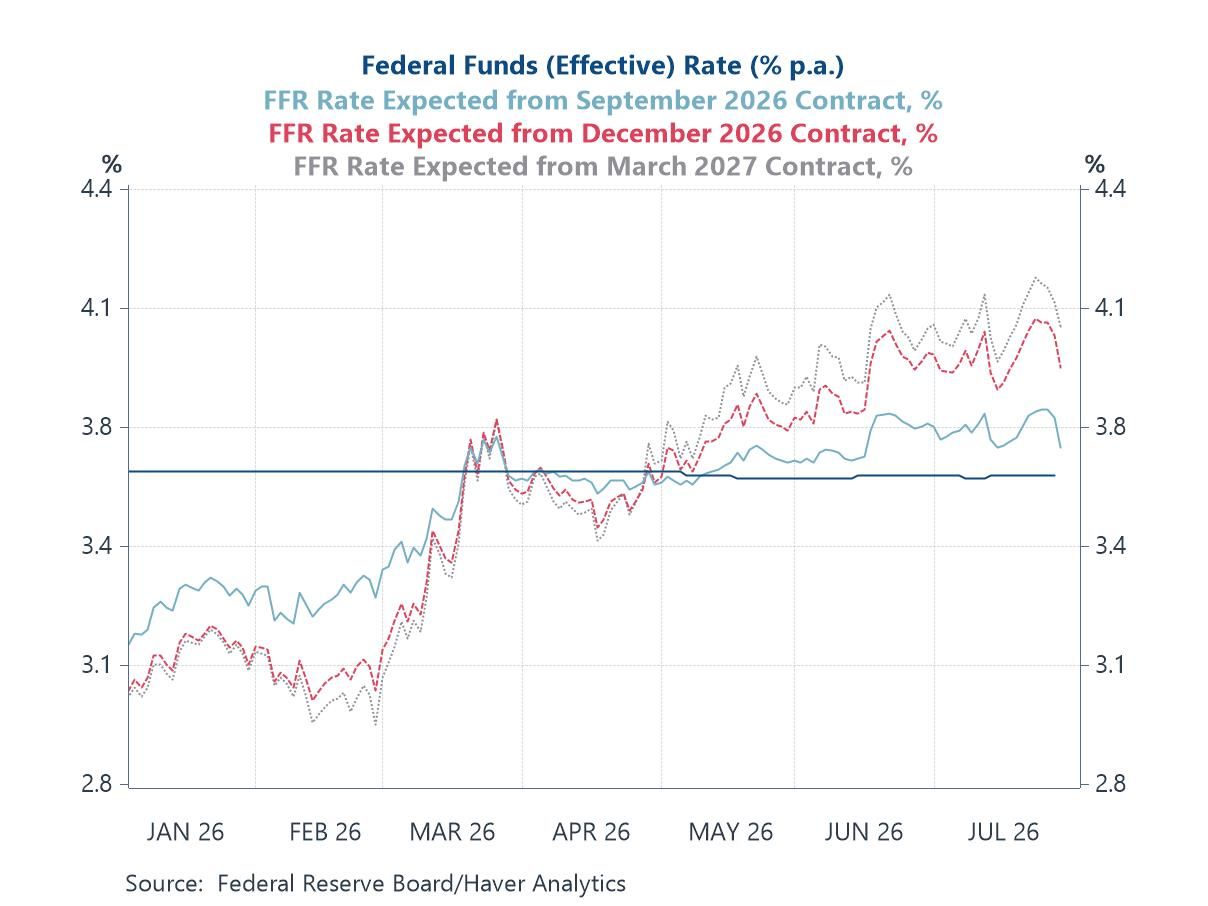
The Federal Reserve left its policy rate unchanged at the conclusion of last night’s meeting, a decision that had been widely expected — the futures market went in pricing only around a one-in-three chance of a hike — but one that split the committee unusually sharply, with three of its members dissenting in favour of an increase to counter inflation that has now run above target for more than five years (chart 1). Yet whatever the near-term path of official rates, the real cost of capital has already moved decisively. The real ten-year yield has climbed to around its highest in two decades, and it has done so in step with a run of firmer-than-expected economic data (chart 2). Behind that resilience lies an investment cycle that is quietly gathering pace. The July flash surveys show the upturn led, unusually, by manufacturing rather than services (chart 3), and the hard data are beginning to agree, with manufacturing orders across many major economies turning firmly higher (chart 4). Equity markets, for their part, have taken elevated real rates in their stride, the bond–equity relationships that fractured in 2022 having since been restored (chart 5) — the signature of a market that believes it has entered a higher-return, investment-led regime. The optimism is not unqualified. A fresh round of US tariffs and a sharp sell-off in chip stocks, led by South Korea, are reminders that the payoff from all this spending is far from assured. And the boom is colliding with a physical constraint: since the breakdown of the US–Iran understanding, Baltic tanker and gas freight rates have surged even as dry-bulk rates have stayed calm (chart 6), a pointed warning about the security of the world’s energy arteries.
by:Andrew Cates
|in:Economy in Brief
 USA| Jul 30 2026
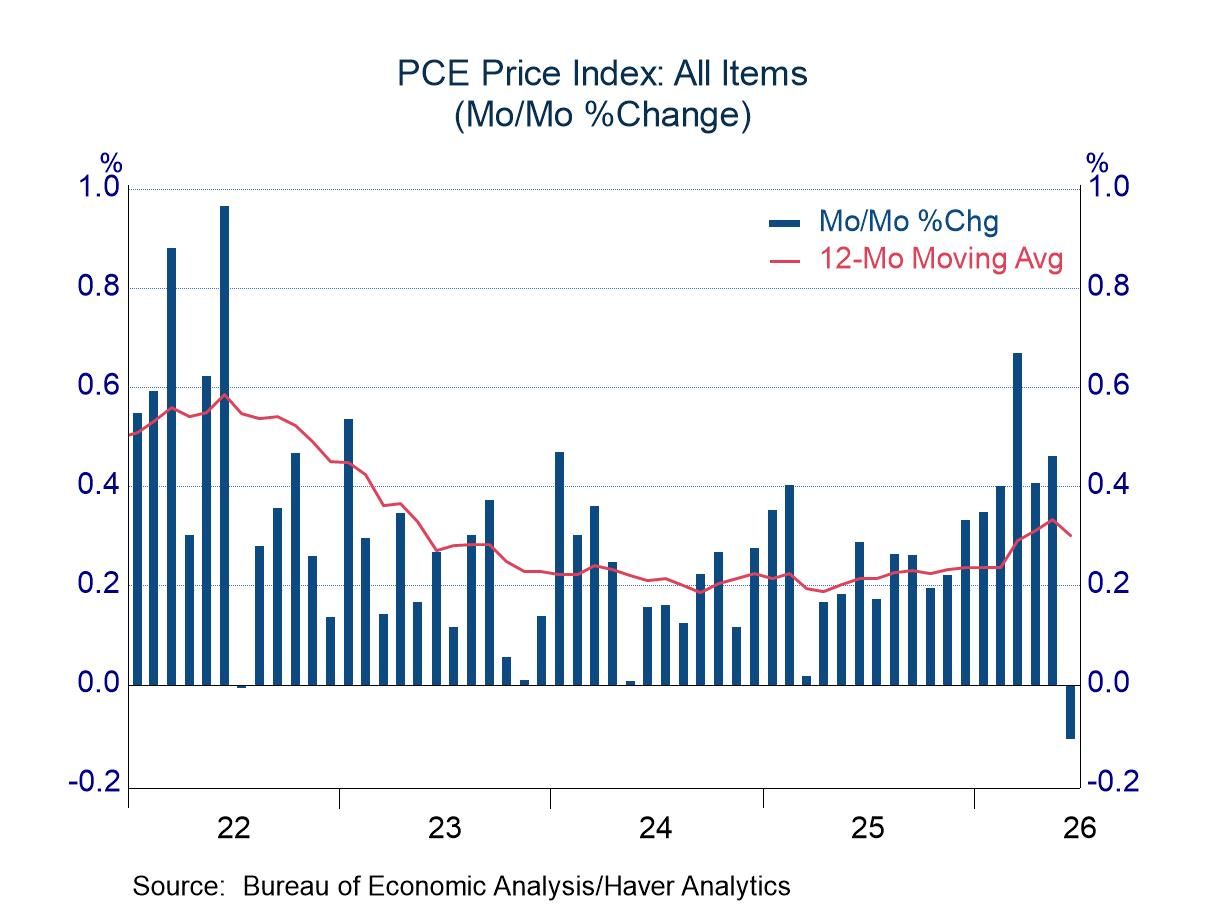
Personal Income, Consumption, and Prices in June
- (Temporary?) relief on price pressures
- Respectable income gain and active spending by consumers
 USA| Jul 30 2026
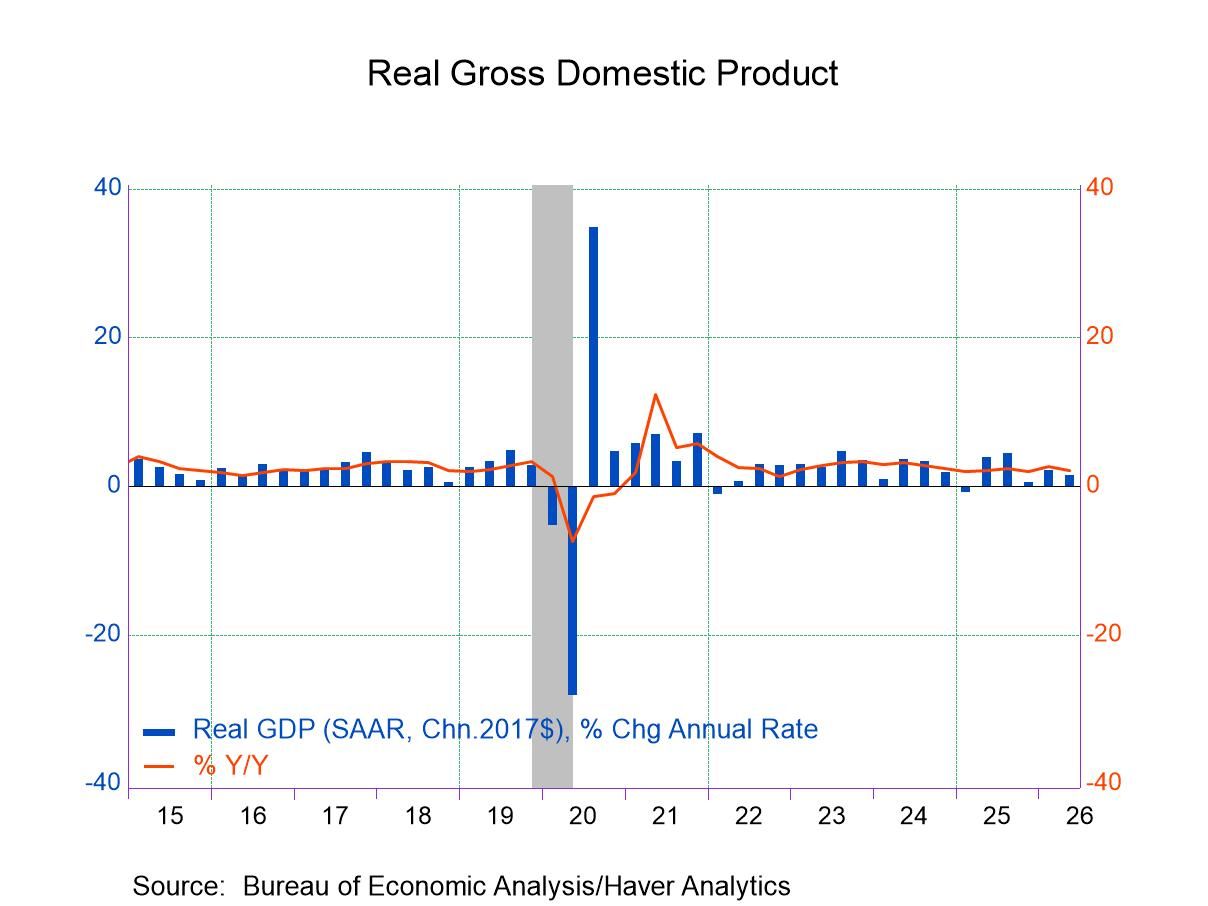
U.S. GDP Increased 1.5% in Q2
- The quarterly gain was led by personal consumption and business spending on equipment and intellectual property.
- Inventory investment and net exports were meaningful drags on overall growth.
- Domestic demand growth accelerated to well above trend.
- Reflecting the jump in energy prices after the escalation of the US-Iran conflict, GDP inflation accelerated markedly.
by:Sandy Batten
|in:Economy in Brief
 USA| Jul 30 2026
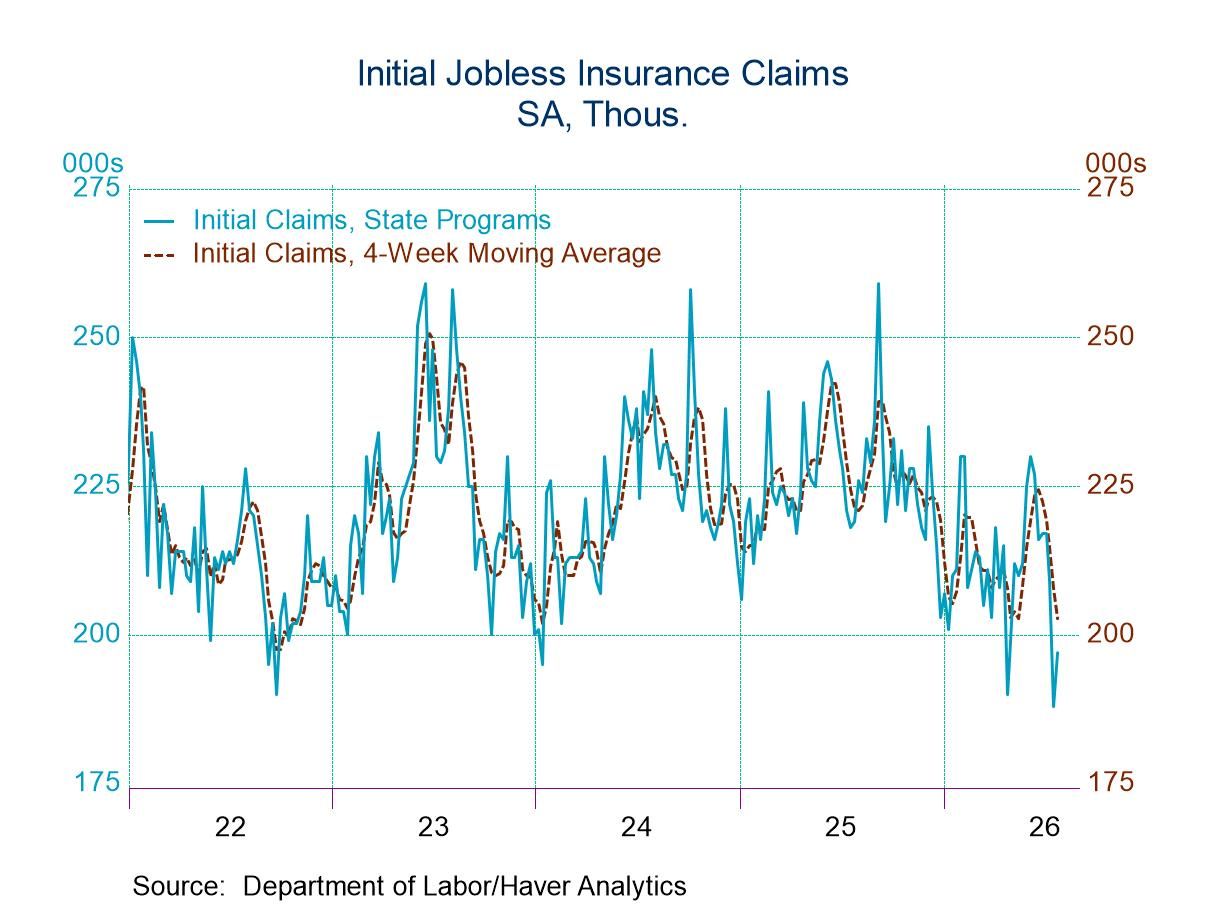
U.S. Initial Unemployment Claims Rose in the Week of July 25
- New claims rose by 9,000 to 197,000 in the week of July 25, after reaching their lowest level since 1969 in the July 18 week.
- Continuing claims declined by 7,000 to 1.782 million in the week ending July 18.
- The insured unemployment rate was unchanged at 1.2% in the week of July 18.
 Europe| Jul 30 2026
European GDP Improves in Q2
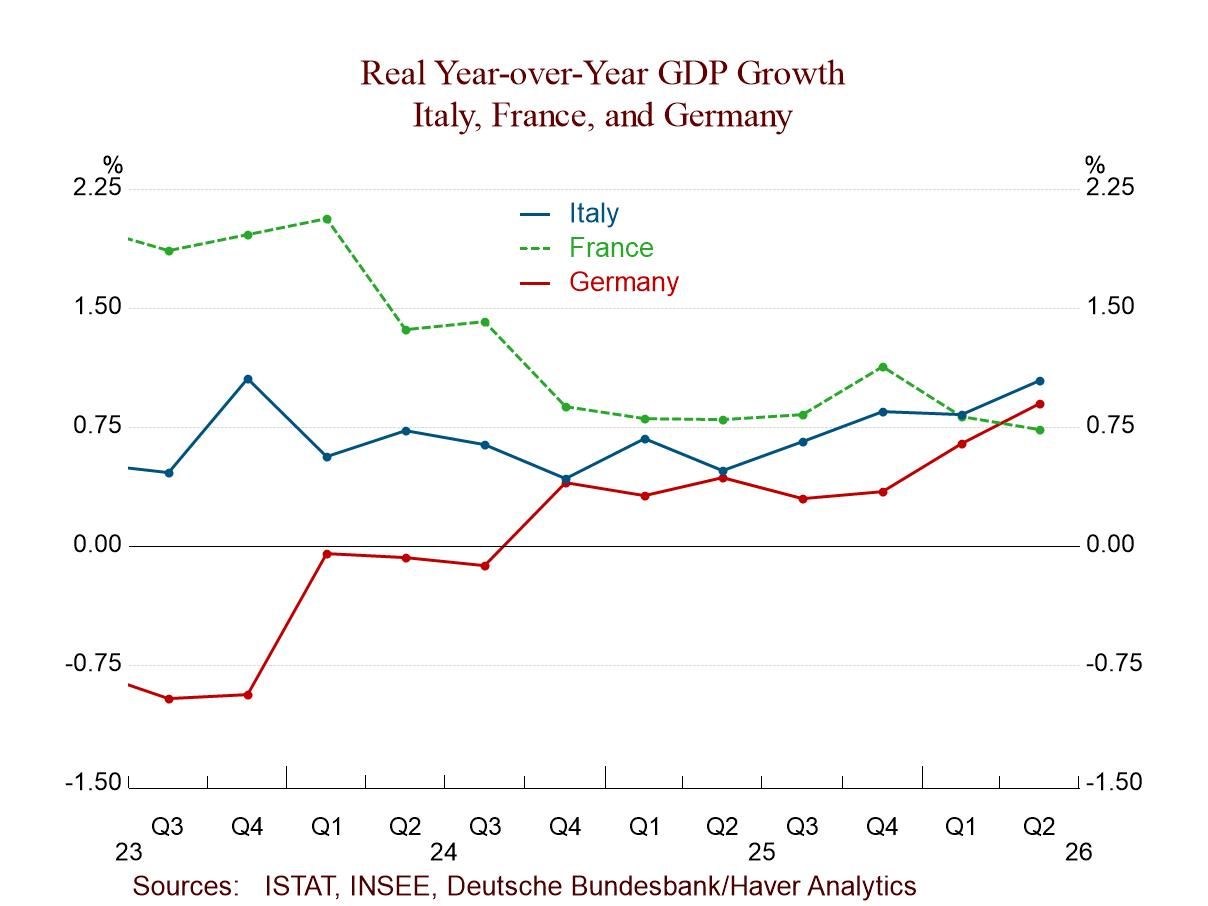
GDP in the second quarter accelerated for most of the countries in the monetary union. The overall figure for the EMU improved to 1.8% as an annualized quarter-over-quarter gain from 0% in the first quarter and 0.8% in the fourth quarter. Among the 8 early reporters of GDP, there was a deceleration in Italy, Germany, and Belgium, while the other five countries showed an increase in their growth rates in the second quarter compared to the first quarter.
The four largest monetary union economies showed a technical weakening, but at the one-digit level, growth was 1.1% in the second quarter, the same as in the first quarter. The rest of the monetary union saw an increase in growth from -2.9% annualized in the first quarter to a gain of 3.7% at an annualized rate in the second quarter, a huge shift.
On a year-over-year basis, growth rates improved for all but three countries: Belgium, France, and Spain. For Spain, the year-over-year growth rate was unchanged at 2.7% in the second quarter. For France, the growth decelerated from 0.8% in the first quarter to 0.7% in the second quarter; for Belgium, the growth rate slowed from 0.8% to 0.5%.
The overall monetary union growth rate rose to 1% in the second quarter compared to a 0.5% increase in the first quarter. The four largest economies showed stronger growth at 1.1% year-over-year compared to 1% last quarter, while the rest of the monetary union showed a GDP gain of 0.5% compared to a year-over-year decline of 0.9% in the first quarter.
Evaluating growth over a longer timeline, three early-reporting monetary union members have standings in their growth rates above their respective 50th percentiles. Those countries are Portugal at 69.6%, Italy at 60.9%, and Spain at 51.1%.
The four largest monetary union economies, pooled together, have a growth ranking year-over-year in their 43.5 percentile. The rest of the monetary union has a growth ranking at the 25th percentile. From this, we can conclude that most of the growth has come from the four large economies, even though in the current quarter it's the smaller economies that seem to be performing much better.
On these same timelines, the United States posted a weaker quarterly growth rate in the second quarter at 1.5%, compared to 2.1% in the first quarter. U.S. growth at 2.1% year-over-year is slower than its 2.7% year-over-year growth rate in the first quarter; it has a queue-percentile standing of its growth rate on data back to 2001 in its 37.5 percentile, a standing well below its historic median for the period. U.S. consumer spending held up pretty well in Q2 and business investment spending remained strong, but the trade account did a turnaround and sucked a lot of life out of the growth rate in the second quarter, keeping the U.S. economy as an important driver of global growth.
 USA| Jul 29 2026
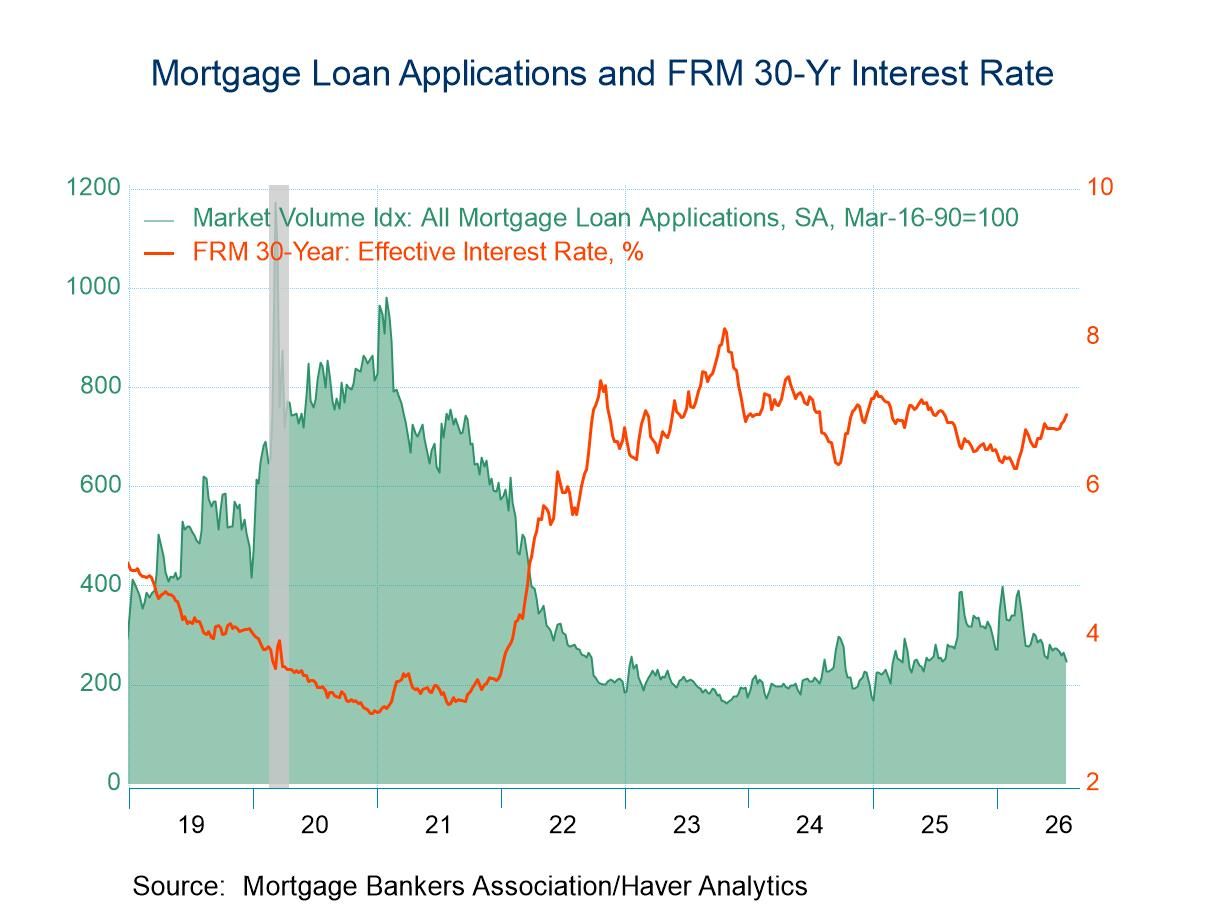
U.S. Mortgage Applications Declined in the July 24 Week
- Both applications for loans to purchase and applications for loan refinancing declined in the latest week.
- Interest rate on 30-year fixed-rate loans rose 9bps to 6.96%.
- Average loan size edged up.
- of8Go to 1 page