The Distributive Trades Survey
The U.K. Distributive Trades Survey for April 2026 and the look-ahead expectation readings for May paint an extremely soured outlook for the U.K. economy.
Retail ranking: Surveys for retail sales compared to a year ago, orders compared to a year ago, and sales evaluated for the time of year all have rankings near zero, which is the worst result on this timeline. This zero distinction applies to retail sales compared to a year ago. The best ranking is 11.6%; that is for sales evaluated for the time of year. Orders compared to a year ago have a 4.2 percentile standing. The stock-to-sales ratio—which is a completely different concept—shows that the inventory-to-sales ratio has a 29.9 percentile standing.
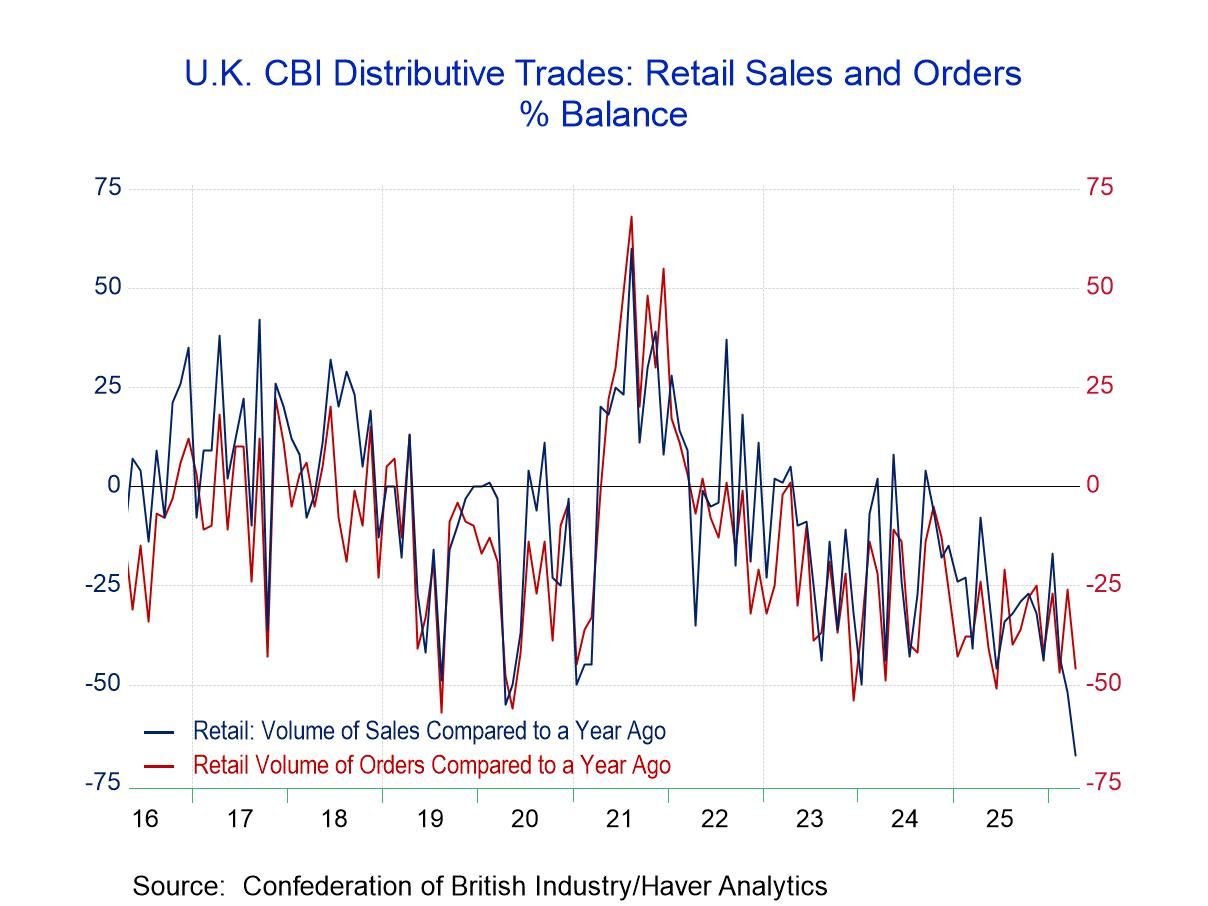
Retail diffusion: The raw April diffusion readings (up minus down diffusion) show that sales compared to a year ago slipped to a reading of -68 in April from -52 in March. Orders fell to -46 in April from -26 in March. Sales evaluated for the time of year fell to -32 April from -23 in March. All three measures weakened, and all three weakened decisively, resulting in extremely weak rankings. All of the rankings are executed on data back to 2002.
Expectations for retailing: The expectations readings for May show slippage again across all three metrics: expected sales compared to a year ago, expected orders compared to a year ago, and expected sales for the time of year. Expected sales compared to a year ago fell to -60 in May from -49 in April. Orders compared to a year ago declined to -45 in May from -30 in April, and sales for the time of year slipped to -43 from -19. In May, these readings have rankings in a 0.4 percentile standing for sales compared to a year ago, a 1.8 percentile standing for sales evaluated relative to the time of year, and a 4.6 percentile standing for orders compared to a year ago. These two panels on current and expected retail sales volumes are just simply terrible: weak monthly, weak in ranking terms, and showing slipping momentum.
The distributor trade series also provides data on the wholesale sector. While the wholesale sector is not quite as beat up as the retail sector, it's still extremely weak. There is no cause for any kind of hope that things are getting better based on wholesaling trends.
Wholesaling: The wholesale survey for sales compared to a year ago edged lower to -32 in April from -31 in March. Orders compared to a year ago remained at a reading of -41 in April. Sales evaluated for the time of year improved to a reading of -20 in April from -39 in March—a significant step up, but still very weak. The percentile standings for these three categories show sales compared to a year ago at the 8.8 percentile, orders compared to a year ago at the 5.6 percentile, and sales evaluated for the time of year at the 14.8 percentile.
Wholesale Expectations: The look-ahead observations, which provide expectations for wholesaling in May, show a similar constellation of readings, with sales compared to a year ago falling to -37 in May from -27 in April and orders compared to a year ago falling to -42 from -38, while sales evaluated for the time of year improved to 16 from 37. That category for wholesale sales improved both in April in real time and in May for expectations; however, it continues to have a very weak percentile standing, at the 17.9 percentile in May, while sales for a year ago have a 6.7 percentile standing and orders for a year ago have a 6.0 percentile standing.
 Global