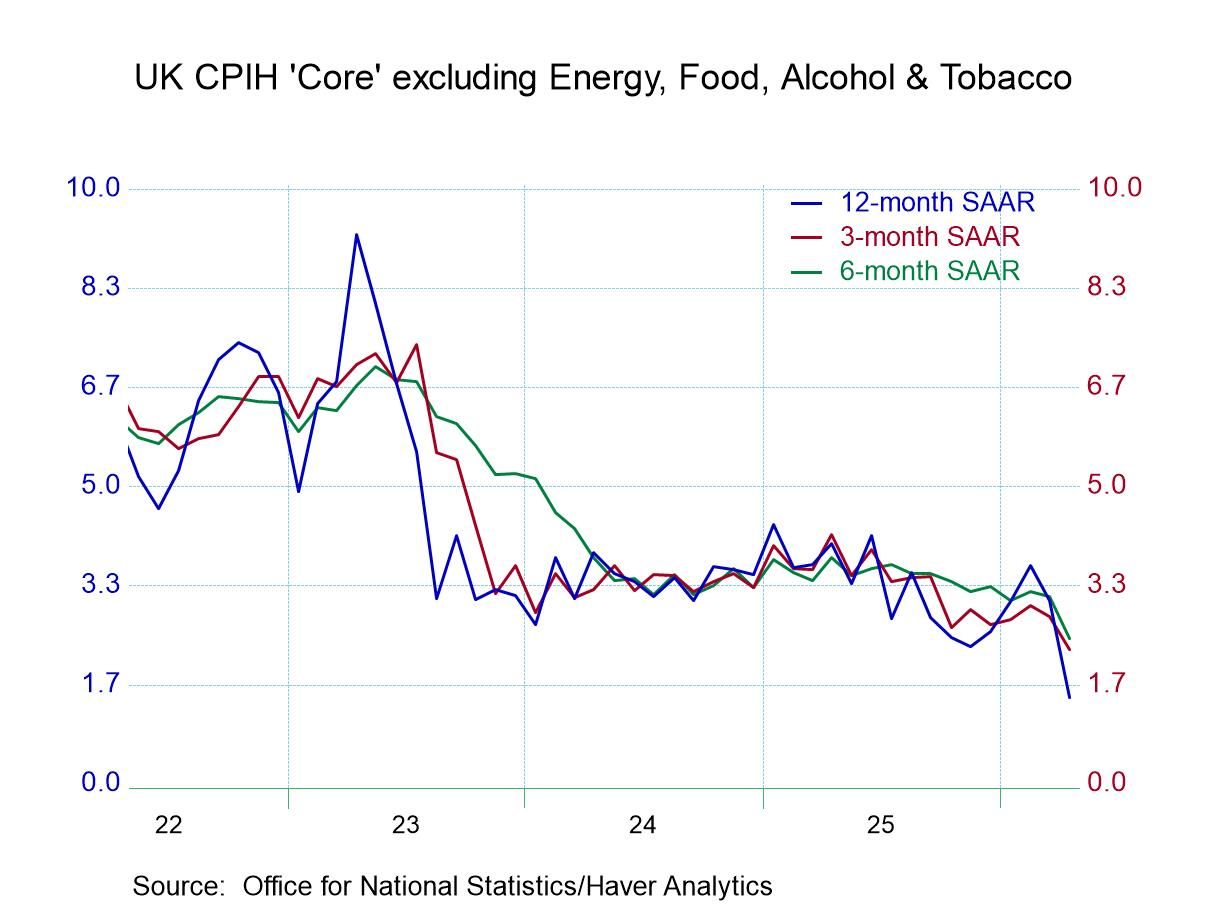
CPI inflation in the UK eased sharply in April with the headline making no change at all and the core rising by only 0.1%. The headline is a marked departures from March when the UK CPI rose by 0.4% as the core put in another good month, rising 0.1%. Sequentially, UK inflation as measured by the CPIH has been relatively stable with a 3% growth rate over 12 months, a 3% annual rate over three-months, and a gain of 2.9% annualized over six-months; it's about as steady as you can get. The core (CPH excluding energy, food, alcohol, and tobacco) rises 2.9% over 12 months, eases to a 2.7% annual rate over six-months, then rises at a 2% annual rate over three-months.
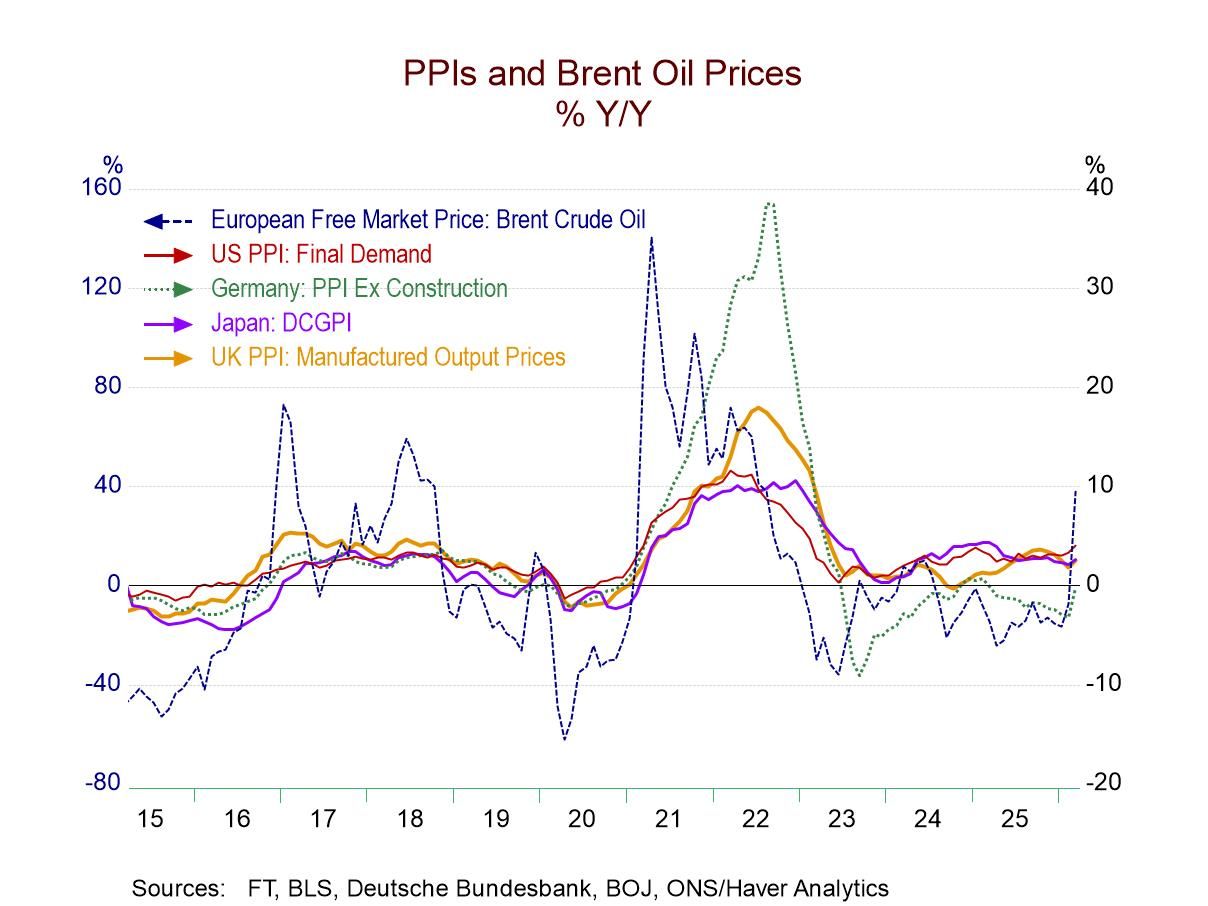
Low inflation amid a global surge in oil prices The core is showing significant temperance and sequential improvement. Meanwhile, globally oil prices are flaring sharply, and most countries are seeing inflation rates rise. An energy cap in the UK is holding energy costs down and helping to keep the headline rate of inflation low. However, the cap can only work its magic for so long, eventually persisting strength in oil prices are going to show through into the headline index.
Acceleration tendencies abate In April, 50% of the categories of the CPI H showed acceleration compared to March; in March only 41% had accelerated compared to February; in February only 41% had accelerated compared to January. On a broad basis, inflation acceleration has been substantially neutralized or controlled. Sequential calculations show that over three-months acceleration has occurred in 50% of the categories, over six-months and 12-months, however, acceleration has occurred in only 33% of the categories, indicating that there has been a relatively long-lived environment of inflation temperance.
Still Too high However, inflation in the UK remains relatively high. The HICP measure, which is comparable to the measures used on the continent by the European Central Bank, has a 69th-percentile standing when ranked on data back to 2000. The CPIH has a 75.1-percentile standing and the CPIH-core has an 81.5 percentile standing. These are based on year-over-year percent changes and the two inflation gauges.
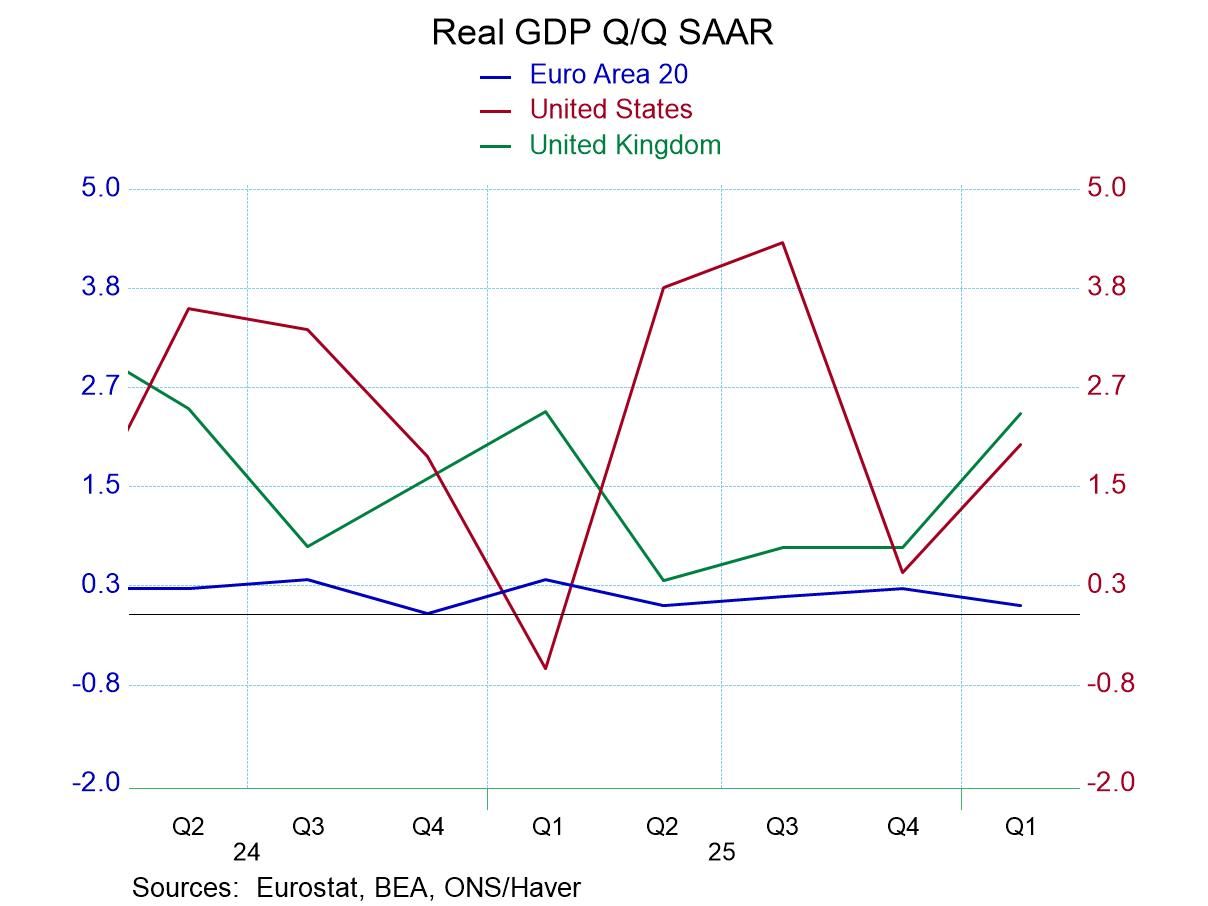
Inflation rankings tell us that inflation in the UK is still relatively high compared to how it has performed over the last 25 years. However, what's most important is inflation relative to the target of 2%. At 3% the inflation rate is too high and at 2.9% the core inflation rate is too-high as well. However, we see the shorter-term inflation rates particularly for the core have come down. The core rate over three-months has even reached the 2% mark, which is both encouraging and surprising. The UK economy has been performing poorly. The Bank of England will certainly be making its next monetary policy decision based on the performance of inflation with some assessment and how the trend is faring as well as with reference to economic performance which has been marginal. We will have to see how the BOE looks at the effect of the energy cap. At the same time there's a great deal of political turmoil in the UK to pair with difficult global geopolitical conditions
 Global