Haver Analytics
Haver Analytics

Economy in Brief: October 2022

  • Trends for the volume of retail sales in the European Monetary Area continue to slip. Sales have fallen month-to-month for three months running and in four of the last five months. However, the amount of the decline has been decelerating with June sales falling 1%, July sales falling 0.4%, and sales in August falling by 0.3%.

    Sequential sales show the opposite pattern, with the rate of decline getting progressively larger. Year-on-year volumes fall by 1.8%; that pace steps up to a pace of -3.3% over six months annualized, and again to -6.1% over three months.

    Food & beverage sales fall in each of the last three months and the decline gets progressively larger. They also fall sequentially over the three horizons with a tendency for declines to get larger. Sales weaken from their -2% pace over 12 months to an annualized pace of -5.3% over six months and to a pace of -4.4% over three months.

    Quarter-to-date (QTD) sales volumes with two of three-month’s data in hand are falling at a 5.2% annualized rate with food & beverage purchases falling at a similar 4.5% annual rate.

    The exception to the trend of weakening sales is from vehicle sales where sales rise strongly by 19.2% month-to-month in August and log progressive growth rates that rise 6.4% over 12 months then rocket to a gain of 26.6% annualized over six months and further to 118.4% annualized over three months!

    The chart at the top presents the ex-auto sales volume figures and the auto registration figures plotted on a two-scale chart as levels in both cases. Because growth has been so subdued this is an effective way to see sales trends and to compare vehicle sales with other retail volume trends especially given the impact of Covid over this period. Percentage change data would be harder to explain.

    The chart shows the clear mutual drop in sales during the Covid period, followed by a rebound that was extended for non-vehicle sales volumes, a rebound that continued to elevate sales to new highs post-Covid. Vehicle registrations, however, never made such a recovery. They failed to reach pre-Covid sales levels and have instead continued to drop, in part, because of supply chain issues as well as demand issues.

    The current strong gain in vehicle registrations still leaves them well short of the recovery nonvehicle retail sales have experienced. While total retail sales are up by 2.6% compared to their January 2000 level and food & beverage sales are up by 0.4%, vehicle registrations are still lower on balance by 16.9%. Of course, over this stretch of time, none of these sales figures is very impressive. Europe has continued to limp ahead in the wake of Covid, now threatened with energy supply problems with winter coming, with war on its doorstep and high inflation.

    EMU and other country retail trends In the EMU and the rest of Europe, individual countries are experiencing sales declines broadly. All countries in the table show declines over three months. Six of eight countries show declines over six months. Six of eight countries show declines over 12 months; one of the two countries where sales don’t decline logs a change that rounds to zero. Portugal shows sales volumes increase over 12 months and six months with a decline at a 2.2% annual rate over three months. Belgium shows an increase in sales values over six months flanked by a 12-month decline of 2% and a three-month drop at a 1.5% annual rate. These are references to the only sales increases over the 24 sequential calculations (eight countries over three horizons each). Over three months, sales decelerate everywhere except for the Netherlands and in the U.K. Five of eight countries show deceleration over six months compared to 12 months. The exceptions are Denmark, Belgium, and Norway.

    Over the quarter-to-date, sales are falling in all countries except Portugal where there is a 3.2% annualized gain. Five of eight countries show sales have increased on balance since January 2020 before Covid struck. The exceptions are Spain, The Netherlands, and the U.K.

    • Employment moves higher.
    • Business activity, new orders & supplier deliveries decline.
    • Price gains ease further.
    • Total mortgage applications plunged 14.2% in the week of September 30.
    • Applications for loans to purchase and to refinance both decreased.
    • The average effective rates on fixed-rate loans rose to multi-year highs.
    • Recent months' gains weaken versus early-2022.
    • Hiring at medium-sized company leads softening.
    • Pay gains remain firm.
    • Deficit is smallest since May 2021.
    • Both exports and imports fell in August.
    • Real trade balance on course to add 2%-points to Q3 GDP growth.
  • Composite PMIs in September largely eroded. The average PMI reading in September fell to 50.9 from 51.1 in August although the median PMI rose to 50.9 in September from 50.5 in August. In September there are eight jurisdictions with readings lower than 50, indicating an overall contraction in the economy. The September reading is a lower number than the 10 that reported contractions in August. Eleven jurisdictions reported slowing conditions in September, compared to 18 in August. These figures account for month-to-month deterioration and while the number 11 is smaller than the number18, the number 11 follows the number of 18 indicating that that were 18 deteriorating in August and in addition to that there are 11 deteriorations in September. There were also 17 deteriorations back in July. The number of deteriorations may have slowed but the accumulated effect clearly is a worsening.

    For the most part, the PMI data haven't showed too much change over the last three months, but there is generally speaking weakness in place. Comparing September to July, the average is weaker, the median is weaker, and we have a long string of jurisdictions below 50 and of entities reporting slowing growth.

    Looking at sequential growth rates from 12-months to six-months to three-months, there's also a clear erosion going on in the average and then the median. On this timeline, the jurisdictions below 50 progressed from 4 over 12 months and six months to 7 over three months and the number of jurisdictions showing slowing progressed from 3 over 12 months to 16 over six months and to 17 over three months.

    Percentile standing depicts how weak these numbers really are when placed in an historic context. We tend to look at PMI data by evaluating readings relative to the 50 mark, since 50 represents the dividing line between an economy that's expanding or contracting. When we do that, we distance ourselves from what the normal readings are for these PMI values and turn the PMI into a binary signal. The percentile standings take a different approach. They position each one of these readings for September in a queue of data over the last 4 ½ years. On that basis, the average PMI reading has a the 37th percentile standing in its range and the median reading is in the 31st percentile of its range. The median reading for each country will occur at a value of 50%. So, when we find that the average reading for these countries is at the 37th percentile and the median of these pooled readings is at the 31st percentile, we are seeing readings that are in the lower one-third of their range of values indicating some extreme weakness. There may still be expansion taking place, but it is weak expansion. In fact, there are only 6-jurisdictions with percentile standings at or above their 50th percentile in the table. The strongest of these is Singapore at its 94th percentile. That's followed by the UAE at its 85th percentile. That's followed by Zambia at its 82nd percentile. Japan is at its 66th percentile, followed by Saudi Arabia at its 64th percentile. Brazil sits on the cusp at its 50th percentile, right at its median value for this period.

    And some of the larger economies have extremely low standings. For example, the United States has a lower 10% standing, the EMU has a lower 12% standing, Germany has a lower 7% standing, the U.K. has a lower 10% standing.

    There's a great deal of weakness indicated by the composite PMIs and these are the results of the manufacturing and services PMIs for each country. These composites are very broad gauges of economic activity. The average rating over 12 months is a diffusion reading of 53.5 that has slipped the 51.2 over three months and to 50.9 in the current month. The median reading has slipped from 53.5 over 12 months to 50.5 over three months and stands at 50.9 as of September. These measures have aggregate activity showing barely any growth at all. So, it’s growth; but it is not normal.

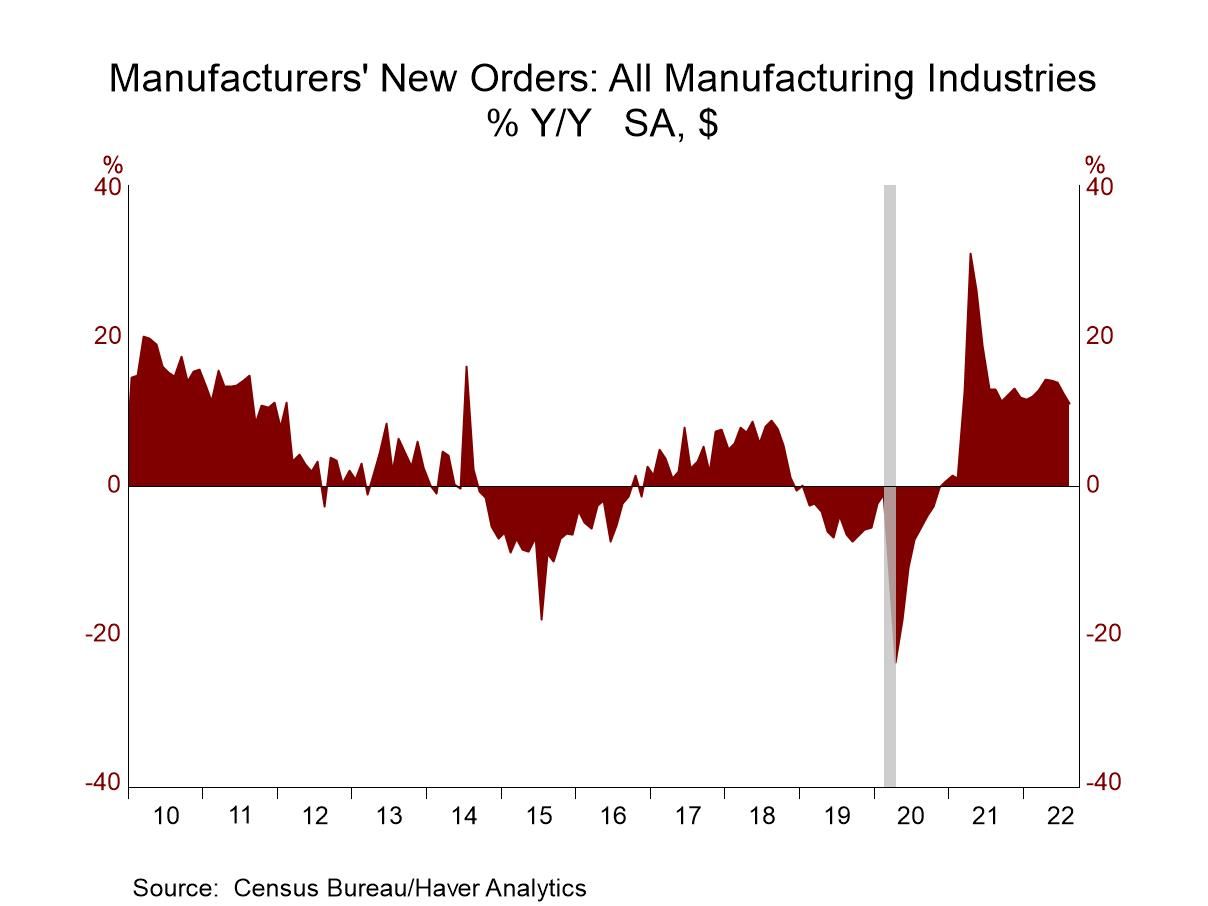
    • Durable goods orders slip, but nondurables orders rise.
    • Shipments rise broadly.
    • Unfilled orders increase but inventories dip.
    • The number of job openings drop 10.0% in August.
    • New hires rise 39,000.
    • But separations increase, reversing much of their July decline.