- Federal funds rate is unchanged in a range of 5.00% to 5.25%.
- Rate is highest since August 2007.
- Economic projections add to real growth & inflation this year.
 USA| Jun 14 2023
FOMC Leaves Fed Funds Rate Unchanged
by:Tom Moeller
|in:Economy in Brief
 USA| Jun 14 2023
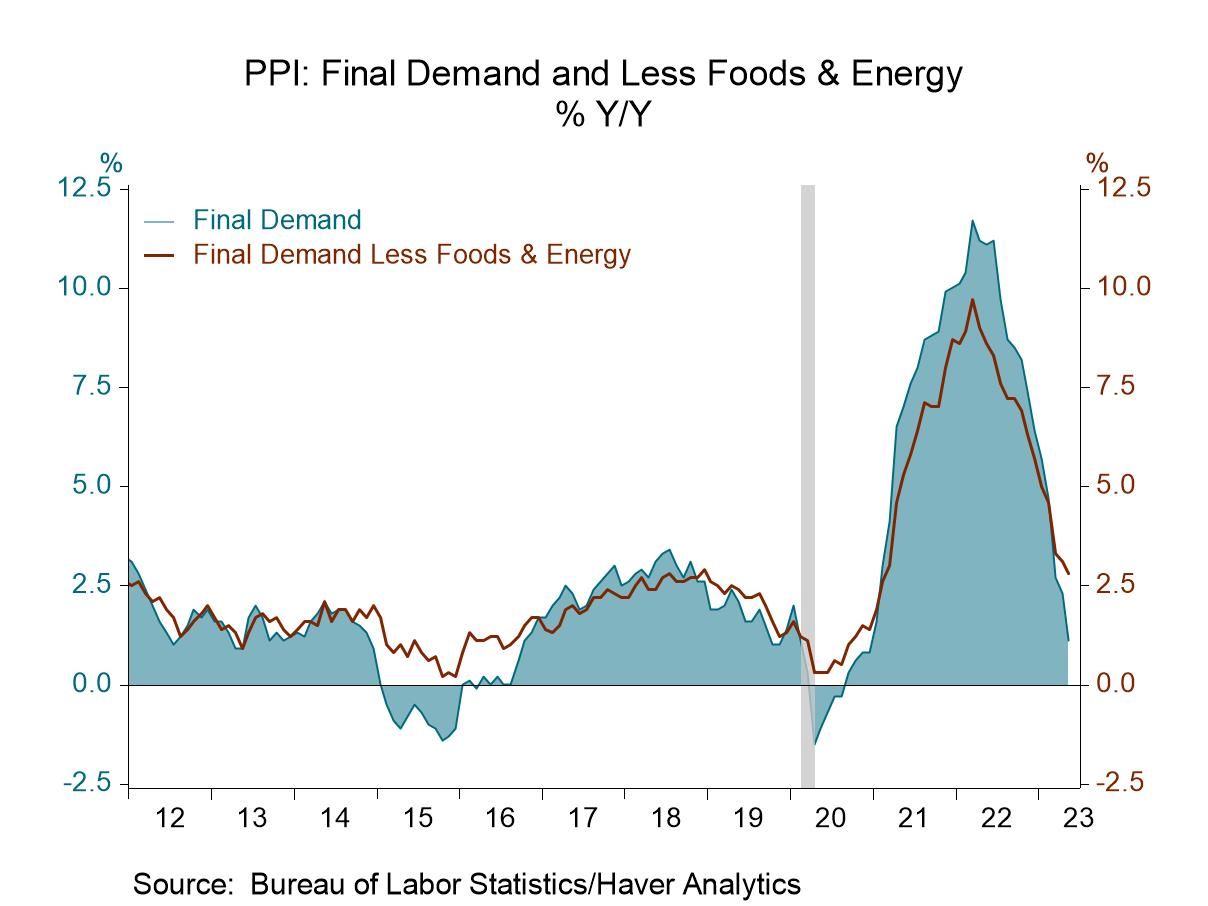
U.S. PPI Declines in May; Core Edges Higher
- Annual gain down sharply from last year’s high.
- Core goods & services prices edge higher.
- Energy & food prices fall sharply.
by:Tom Moeller
|in:Economy in Brief
 USA| Jun 14 2023
U.S. Mortgage Applications Rebound to a Four-Week High After Four Straight Weekly Drops
- Following four successive w/w declines, applications for loans to purchase rise to a four-week high and applications for refinancing a loan rise to a three-week high.
- Effective interest rates decline for 30-year FRM but rise for other types of mortgages.
- Average loan size falls for the third consecutive week.
 Europe| Jun 14 2023
EMU Trends Erode with Considerable Volatility
Industrial output in the European Monetary Union grew by 1% in April with manufacturing shooting up by 3.7%. Hold the applause on this, however. Because this is a rebound from a larger 3.8% drop in March and a larger 5.8% drop in manufacturing output. While output overall and in manufacturing had gained in February, the 3-month change shows a decline in total EMU industrial production had a 5.8% annual rate over three months compared to manufacturing where there is a decline of 4.6% at an annual rate. The outsized increases posted in April do not reverse the trend weakness in industrial production or in manufacturing output in the European Monetary Union.
April: strong with isolated strength April's rebound, in fact, is wholly the result of strength in the capital goods sector where output surged by 14.7% after contracting by 15.2% in March. Consumer goods output fell by 2% in April, intermediate goods output fell by 1%. Both consumer goods and intermediate goods output have fallen for two months in a row. The strength that appears in April industrial production and in manufacturing output is wholly the result of a partial recovery in capital goods output.
Sequential rates of growth flag weakness Sequential rates of growth in overall output and in manufacturing output show progressive deterioration. For manufacturing, there's a 1.3% gain over 12 months, a 2.7% annual rate decline over 6 months, and a 4.6% annual rate decline over 3 months - that's a clear worsening pattern. Consumer goods output comes close to showing a deteriorating trend, but minor differences in the growth rates between 3-months and 6-months prevent that from occurring. Consumer durable goods output shows progressively smaller declines from 12-months to 6-months to 3-months. Nondurable goods output carries the day for progressive weakening trends. Intermediate goods also show diminishing sequential weakness as a 6.1% decline over 12 months becomes a 5.1% annual rate decline over 6 months and diminishes further to a 4.7% annual rate fall over 3 months. Interestingly and ironically, capital goods endorse the progressive deterioration trend with the 9.5% increase over 12 months, a weaker 0.3% annual rate decline over 6 months and a 3.7% annual rate decline over 3 months.
Country patterns Country patterns show broad output declines for manufacturing across 13 EMU countries reporting in April with eight showing declines in manufacturing (all of them, month-to-month declines of 1.8% or more). Country data also show 9 EMU members with output declining in March. March and April show much worse conditions than February when only 3 EMU countries showed month-to-month declines in output. Over 3 months eight European monetary union countries show output declines, seven countries show declines over 6 months, six countries show declines over 12 months. However, if we look at the median results for these countries, the median decline is 3.1% over 12 months that shrinks to a 1% decline at an annual rate over 6 months and then expands back to a 2.3% annual rate decline over 3 months, imposing no clear secular pattern, but showing persistent declines. However, over these three periods, as well as over the three most recent months, fewer than 50% of the reporting countries show output is accelerating when we evaluate it period-to-period. For example, output over 12 months is accelerating compared to 12-months ago in only 36% of the categories. That improves over 6 months as over 6 months 46% of the categories show output accelerating compared to its 12-month pace. However, over 3 months, only 36% of the categories show improved growth rates compared to what they log over 6 months.
 United Kingdom| Jun 14 2023
UK economy returns to growth in April
The latest estimates for UK GDP growth suggest the economy picked up again in April. That said, the UK’s growth performance remains choppy and uneven and downside risks remain acute.
The highlights of this report were as follows:
• In April, the UK economy grew by 0.2%m/m, which mostly offset a decline of 0.3% in March. This was in line with UK economists’ expectations.
• Looking at the three-month period leading up to April, GDP grew by 0.1%, matching the pedestrian rate of growth chalked up over the previous three months.
• The growth in output in April was mainly driven by the services sector, which saw a 0.3% increase in output following a 0.5% decline in March.
• More specifically, output in consumer-facing services grew by 1.0% in April, reversing the 0.8% decline seen in March. The food and beverage service sector played a significant role in this bounce-back.• In contrast, output contracted in other key component sectors such as production and construction. Specifically, industrial production fell by 0.3% in April after an increase of 0.7% in March. The construction sector in the meantime saw a 0.6% decline in output in April following a 0.2% rise in March.
by:Kritika Jain
|in:Economy in Brief
 USA| Jun 13 2023
U.S. CPI Increases Negligibly in May; Core Prices Rise Steadily
- Core goods prices hold steady.
- Service price strength is sustained.
- Energy prices fall sharply; food prices edge higher.
by:Tom Moeller
|in:Economy in Brief

- Expectations for economic and business improvement were bleak.
- News on the inflation front improved but wages remained tight.
- Worries about labor quality persisted as firms struggle to fill openings.
 USA| Jun 13 2023
U.S. Energy Product Prices Mostly Improve in Latest Week
- Gasoline prices edge higher but diesel fuel prices ease.
- Crude oil & natural gas prices rise slightly.
- Petroleum demand increases.
by:Tom Moeller
|in:Economy in Brief
- of11Go to 6 page