Haver Analytics
Haver Analytics

Introducing

Robert Brusca

Robert A. Brusca is Chief Economist of Fact and Opinion Economics, a consulting firm he founded in Manhattan. He has been an economist on Wall Street for over 25 years. He has visited central banking and large institutional clients in over 30 countries in his career as an economist. Mr. Brusca was a Divisional Research Chief at the Federal Reserve Bank of NY (Chief of the International Financial markets Division), a Fed Watcher at Irving Trust and Chief Economist at Nikko Securities International. He is widely quoted and appears in various media.   Mr. Brusca holds an MA and Ph.D. in economics from Michigan State University and a BA in Economics from the University of Michigan. His research pursues his strong interests in non aligned policy economics as well as international economics. FAO Economics’ research targets investors to assist them in making better investment decisions in stocks, bonds and in a variety of international assets. The company does not manage money and has no conflicts in giving economic advice.

Publications by Robert Brusca

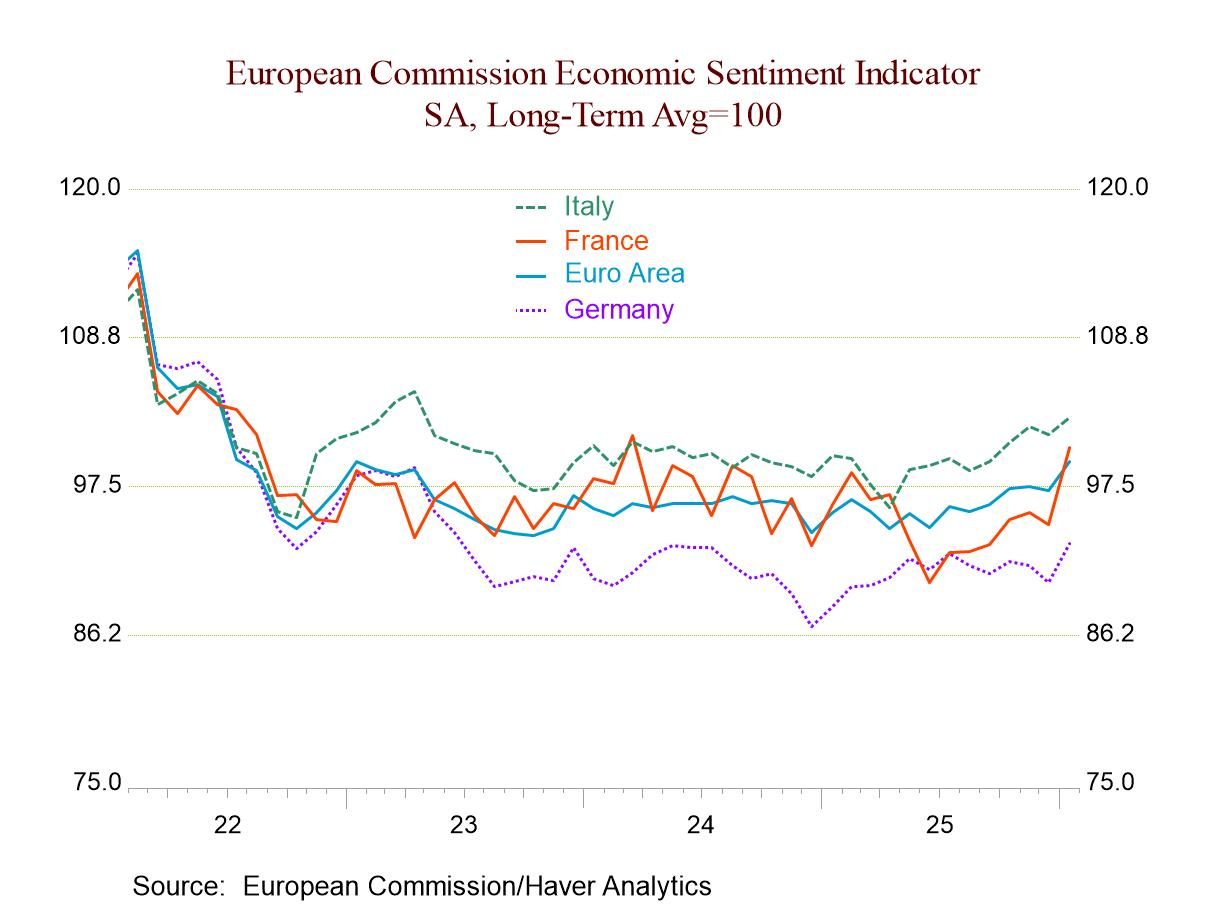
  • The European monetary union’s index of sentiment created by the European Commission rose sharply in October to its highest level since April 2023. There were improvements in the three of the five sector indexes reported with only construction and services unchanged in October relative to their September values.

    Despite the nice step-up in the indexes in October, they are still at relatively low values. Only two sectors, construction and retailing, have readings above their 50th percentiles with construction at a 77.5 percentile standing and retailing at a 51.5 percentile standing. The service sector has a low 27.5 percentile standing, consumer confidence is at a 24.3 percentile standing, and the industrial sector is at a 35.9 percentile. Data are ranked over observations back to 1990, where feasible.

    ‘Better’ is not always ‘good’ Clearly the euro area is not performing particularly well at this time. The rankings data make that especially clear. The service sector and the industrial sector are substantially below their historic medians. The median occurs at a queue (or rank) standing at the 50-percentile mark. Consumer confidence is in the lower 25-percentile of its range for this period; services are in their 27th percentile – a low ranking for such an important job creating sector.

    The largest have the best October showing The four largest economies in the euro area lead the way in the month and on the broader trip to mediocrity. Germany, France, and Italy each rise by one percentage point or more in October. More broadly, Italy and Spain are the only two ‘large economies’ with percentile standings above their respective 50th percentiles: Spain is at a 55.3 percentile standing, Italy at a 50.9 percentile standing. The largest two economies in the monetary union, Germany and France, respectively, have standings at the 19th percentile for Germany in the 33rd percentile for France.

    Granular performance of the Euro Area In October only one large economy backtracked compared to September and that's Spain; its hard decline of 0.9% came after its index rose by 2.9% in September. Among the remaining 14 economies, seven of them showed declines in October and seven of them showed increases. The pickup and performance for the monetary union in October is substantially on the back of the larger economies that are doing better while these smaller monetary union members are clearly mixed.

    Standings In terms of standings, the smaller monetary union economies show 5 of 14 with standings above their 50th percentile. These are Portugal at 51.5%, Cyprus at 56.2%, Lithuania at 64.4%, Greece at 71.1%, and Malta at a strong 89.1%.

    Summing up It is a good month statistically for the euro area. However, the gains are not widespread, and the sector performance is still mixed. But this is the strongest level for the EU sentiment index since April 2023, and that is something.

  • An upswing appears to be underway with both manufacturing and services readings improving. The S&P PMI data for October covered eight different reporters, five of which improved in October compared to September. September had been an extremely weak set of readings; out of the 24 different categories (eight countries with three readings each), there were only five that improved in September compared to August. August had been a strong month. The survey clearly is showing some volatility over these past few months; however, in October we're seeing a fairly broad-based increase, with only nine of the 24 detailed categories that assess the composite, manufacturing, and services showing weaker performance compared to September. And of those comparisons across eight countries, 19 sectors and composite indexes had been weaker month-to-month in September compared to August.

    Over three months the averaged composites are stronger compared to six-month average. Among all the reporters, only three of the 24 sectors and composite readings show weakness in three-months compared to six-months. Each of those weakening readings is for manufacturing. They involve weaker manufacturing in Japan, in Australia, and in the United States. Ten of 24 sectors and composite readings weaken over six months compared to 12-months. Only 7 detailed readings out of 24 weaken over 12 months compared to 12-months before based on comparing averages.

    Queue percentile standings take the October values and rank them in a queue of data back to January 2021 expressing the standing in October as a percentile in that queue of readings. The average percentile standing for the composite indexes in October is at 55.6%. The average manufacturing sector’s queue standing at 52.2% while the average services rating is at 54.1%. In October, all of the readings averaged across the 8 reporters are above their medians for the period back to January 2021 compared across monthly data. That's not an exceptionally strong performance, but it's a solid performance. Among the reporting countries, only Japan, the United Kingdom, and France have composite standings that are below their medians (that is, they have ranked standings for their respective composites below their 50th percentile).

    The average standing across the 8 reporters in October generally shows an improvement from September; September was weaker than August. With that, October values, while higher month-to-month, were lower than they were in August. For example, the overall composite in October moved up to 52.8 from 52.5 in September, but September had fallen from 53.9. Values in October are still below values in August. The same thing is true of services and manufacturing.

    The average sequential data for 3-months, 6-months and 12-months, however, show steady improvement with composite readings rising from 51.8 for 12-months to 51.9 over six months and to 52.6 over three months. These calculations are performed only on hard data and are up to date through September. The October monthly reading for the composite, for manufacturing and for services are stronger for each of these readings in October compared to three-month averaged values ended in September paving the way for continued improvement ahead.

    Overall, the sense of improvement here is slow. Compared to January 2021, the October readings are stronger for composite and for services but weaker for manufacturing; that sector is taking longer to recover. Still, recovery seems to be in gear; if that remains the case, central banks may have to rethink their programs of ongoing interest rate cuts.

  • Consumer confidence in Finland slipped in October. The -7.6 reading was a slip from -6.6 in September, bringing it back to its August level of -7.6. The 12-month average for confidence is -7.9; the 12-month low is -9, so there hasn't been a lot of change in consumer confidence over the past year. Confidence currently is relatively firm compared to its recent range in its 12-month average even though it is slightly below that average. The queue ranking for the October level is at its 23.9 percentile, putting it in the lower quarter of its rank of data; one year ago, consumer confidence ranked in its 26th percentile. There's been a modest improvement in confidence over the past year. The rankings are executed over data back to 2002, a ranking over a period of roughly 23 years.

    Macro and micro trends The microeconomic indicator for Finnish consumer confidence improved slightly in October, rising to 22.4 from September’s 21.8. At 22.4, it is slightly below its 12-month average, and it has a ranking of only its 11.2 percentile, which is a slippage compared to a 22-percentile standing one year ago. The macro indicator for consumer confidence slipped to -21.7 in October from -20.5 in September; it is slightly above its 12-month low at -23.3 and almost exactly on its 12-month average. The ranking for the macro indicator is in its 22nd percentile, nearly identical to what it was one year ago.

    Some details In terms of the rankings, the Finnish consumer confidence survey is dominated by extremely low rankings. Most of them are lower 25th percentile or even lower; however, the index has some redeeming qualities. Among them is the fact that unemployment in Finland, although it deteriorated slightly in October to -30.1 from -27.8 in September, has only a 22.8% standing and it's lower than it was a year ago. People's perception of the personal threat of unemployment fell significantly in October to -17.1 from -12.5. in September; the ranking for that measure is in its 7.7 percentile, a very low ranking and is an improvement from the 17-percentile standing of one-year ago. Despite the weakness in the economy and the difficulties consumers are having in their assessments of confidence, they don't have any kind of fear and certainly not a growing fear of unemployment. That clearly is a silver lining in what we could regard as the dark cloud that dominates this report.

    The assessment of the economy now slipped to -40.1 in October from -34 in September. The economy in 12 months is not assessed to be much different than it was a month ago and its ranking in October 2025 is substantially the same as it was one year ago (about a 30-percentiel standing). The assessment of consumer prices showed a slight reduction in inflation in October; however, the ranking of inflation is elevated at a 65.2 percentile standing that's above its historic median, but it's a substantial improvement from the 83-percentile standing of one-year ago.

    The environmental assessments for the month of October showed a deterioration in the favorability the timed the purchase durables at a -16.6 reading in October compared to -12 in September. The favorability of saving was unchanged at -8.3 in September and October. The favorability of a time to raise a loan balance slipped to -29.4 in October from -25.3 in September; the household financial situation slipped slightly to 22.9 from 24; and the possibility to save over the next 12 months rose to 38.2 from 34.5. The rankings on these various metrics remained in the 12th or 13th percentiles for the purchasing, savings, and loan balance assessments. The household financial situation has a higher standing at a 27th percentile - still a nearly a bottom 25% standing. And the possibility to save over the next 12 months, while it improved in the month, has an 8-percentile standing.

    Finland did not improve on the month; however, it shows trending toward better times and unemployment fears are low.

  • Industrial orders in the United Kingdom fell to a reading of -38 in October from -27 in September this compares also to a level of -33 and August. The 12-months to 6-months to 3-month average progression shows steady deterioration for orders with the 12-month average at a -31 reading, compared to the October reading of -38. Dated back to 1991 the current orders reading ranks in the lower 8% of its historic queue of data, among the observations on that timeline marking this as an exceptionally weak reading on the month and, underpinning the notion, that growth in the UK is weakening and perhaps providing for the Bank of England a way to avoid raising rates in the face of what continues to be excessive inflation.

    Export orders also slipped in the month to -46 compared to a reading of -32 in September and -33 in August. Export orders also have deteriorated steadily as the 12-month, the six-month, and the three-month averages are becoming sequentially weaker. Comparisons show the 612-month average at -33 to this month's -46 reading. The percentile standing for export orders is similarly weak to overall orders at a 7-percentile standing.

    Looking ahead, the output volume for the next three months finds the index at -19, down from -14 in September and -13 in August. The sequential reading on this metric weakens as well from readings of -9 over 12-months to -12 over 6-months to -15 over 3 months. All that compares to the current October reading of -19. The deterioration there is clearly in place; the queue percentile standing of the October level is at 6%, marking it, once again, as exceptionally weak.

    Looking at the prices over the next three months brings an unfortunate increase to 16 from 4 in September and 9 in August. However, the expected inflation results are not on the same deteriorating path as orders trend and expected output. Despite the monthly jump in October, the 12-month average of ‘expected inflation’ is 18, that's reduced to 16 over 6-months and further reduced to 10 over 3 months. The jump in October is a jump that is away from trend, and I suppose we will have to wait to see where it settles in. The trending results for inflation are somewhat more encouraging. The jump in October is quite discouraging although it does come against the background of weakening economic data which simply puts the central bank in a more difficult position to make a policy decision. Price expectations for 3-months ahead have a ranking in their 73rd percentile meaning that they have been stronger a little more than 25% of the time on data back to 1991.

    The PMI industrial indicator is up to date through September; here we have a comparison of the manufacturing PMI to the CBI survey. The manufacturing PMI eased to 46.2 from 47 in September. The manufacturing PMI on averages over 12-months, 6-months and 3-months is without a clear trend and has been fluctuating. The manufacturing PMI on data back to 2021 has a 12-percentile standing. The clear message is that conditions in manufacturing in the UK are very weak as the CBI and PMI percentile standings agree. Combined with the CBI inflation outlook, it leaves the BOE in a difficult place.

  • Inflation in the UK rose by 0.1% according to the CPI headline in September. This was a step down from the 0.3% increase in August. The core CPI-H (excluding, energy, food, alcohol, and tobacco) rose by 0.2% in September, the same as in August and in July. Sequentially the CPI-H rose 4.1% over 12-months, rose at a 3.8% annual rate over six-months, and rose at a 3.3% annual rate over 3-months for the headline CPI-H. That marks a clear decelerating pattern from 12-months to 6-months to 3-months. That same phenomenon is reproduced by the core, where the year-over-year inflation rate is 4% ,the 6-month annual rate drops to 3.5%, and the 3-month rate drops again to 2.7%.

    This is good news for the UK. Inflation has been excessive for quite some time. The Headline and core metrics showed year-on-year gains of 2% or less last in July of 2021 a period of over four years. The chart at the top of this report shows the sequential inflation rate plotted for the core CPI-H. In plotting that I'm plotting the measure that looks the best because the headline CPI-H does not decline anywhere near as much as the core does. However, since the core is more permanent and less fickle in its trend it's probably the better way to look at inflation in the UK as well as at the progress being made and to think about the policy options.

    The diffusion calculation by month which looks at the categories and looks at the percentage that are accelerating versus decelerating, shows only 9% of categories accelerating in September, 45% accelerated in August, and 45% accelerated in July. That means for the last three months the monthly categories were generally showing lower inflation across most categories than they had in the month before.

    The table also replicates diffusion calculations for 12-months, 6-months, and 3-months; in each case diffusion is compared to the previous period on the table. 12-month inflation accelerates in 45% of the categories compared to a year-ago 6-month inflation accelerates in only 27% of the categories compared to the 12-month horizon while over 3-months only 18% of the categories accelerate compared to 6-months. Once again, these categories show us that inflation is decelerating broadly across these categories underpinning the sense of good news that we see in both the headline and in the core as each is showing inflation on a decelerating profile.

    Meanwhile, on the unemployment front, the UK unemployment rate is mildly rising from a 4.1% rate 12-months ago to 4.4% 6-months ago to 4.7% 3- months ago. The most up-to-date reading on the unemployment rate is for July and that's a reading of 4.8%. The unemployment rate has clearly been creeping up and that 4.8% has about a 40th percentile standing in the queue of data on unemployment back to early 2000. The unemployment rate standing is still below its median however it's beginning to creep up. The claimant rate of unemployment is slightly more up-to-date as we have a figure as of August. Even though the claimant rate is lower than the unemployment rate, historically it has usually been lower so that the percentile ranking of that rate is actually much higher than for the overall unemployment rate at 71%. That is a bit more disturbing.

    Still, if we rank inflation in the UK as of September the year over year inflation rate compared to where inflation has been since early 2000, that rate ranking continues to be a high. At the level of 4.1% year-over-year rate translates into 87 percentile standing while the 4% core rate translates into an 85-percentile standing. Only two categories and the CPI-H have standings below their 50th percentile; one is for furniture household equipment & maintenance and the other category is miscellaneous goods and services.

    How we view inflation in the UK has a lot to do with which of the profiles we really want to look at to be the policy focus. If we insist on looking at year-over-year inflation the inflation is still too high and stubborn, however, if we look at the 3-month inflation rates, inflation is much lower and making much better progress toward the Bank of England's goals. Economic data have been weakening that's something that could push the Bank of England toward rate cuts even with the excessive inflation numbers that it's printing because it makes the economy seem to be slipping into a period of weakness. In that event, the BOE might expect that the period of weakness will do a lot of ‘the work’ in terms of getting the inflation rate lower.

    This is going to be something to watch and the upcoming weeks not just as the Bank of England prepares for its next meeting but farther than that is it assesses whether it’s concerned about reducing inflation now or whether it thinks that growth is already on a reduction path that will allow it to shift gears and try to cushion the economy as it slows down. The Bank of England is facing a policy dilemma and it will bear watching to see which prong of the dilemma it chooses to emphasize

  • New Zealand exports surged in August as imports plunged causing a twist in the in the month-to-month trade balance that was thrust into a modestly positive surplus from a deeply negative position in July on these trends. New Zealand trade moved into a surplus of $NZ305 million, compared to a deficit of $NZ703 million in July The progression of deficits shows A 12-month monthly average monthly deficit of $NZ265 mln, a six-month monthly average deficit of $NZ137 mln and then an expanded monthly average deficit of NZ$278 mln over three-months.

    Exports rose by 20.8% over 12-months; export performance then cools over six-months followed by an exports surge of 35.5% over 3-months. This is in sharp contrast to imports, where imports fall by 1.1% over 12-months then fall at a 10.3% annual rate over six-months before recovering to rise at a meager 0.9% annual rate over 3-months.

    New Zealand's international reserves excluding gold have continued to creep up sequentially. Inflation has hovered around the 2.5% to 2.7% since March of this year ending a period during which New Zealand inflation consistently overshot inflation in the US.

    New Zealand's exports are and have been showing life better than imports for some time. Ten-year NZ government bond yields have been stuck in the 4% to 4 1/2% range. New Zealand's GDP growth has been locked in an extremely low range with negative GDP growth logged in the last three quarters of last year. It is displaying erratic and continued weak performance in 2025. The import restraint recorded in the trade accounts reflects weak domestic demand that stems from weak GDP growth.

    The NZ CPI that has stabilized but also shows the potential to have ceased falling and may be mounting a period of some minor acceleration starting at rates around or below 2.5%. However, core inflation remains restrained and still in a declining mode – a strong counterpoint to the potential for acceleration. Meanwhile, the unemployment rate has been pressured higher. In the second quarter it shot back up to 5.2%, which is the peak that it experienced during Covid in 2020. New Zealand's current account deficit as of the second quarter continues to shrink, Economic weakness should keep interest rates headed lower and keep inflation contained for at least the balance of the year.

  • Inflation reports are still very much of market interest largely because inflation remains in the forefront, sufficiently contained, to allow central banks to choose a policy course of easing monetary policy. To stay on that course, they will need for inflation to remain under control.

    The German PPI in September is flat after falling 0.5 in August and rising only 0.1% in July. The PPI excluding energy has flattened in July, fallen by 0.2% in August and is up by only 0.1% in September. Both of these PPI series generate significant optimism sequentially as well. The PPI headline series falls by 1.7% over 12 months; it falls at a 2.5% annual rate over 6-months, and it falls at a 1.6% annual rate over 3-months; its change is negative on all three horizons. Inflation is quite contained and reinforcing of the theme of cutting interest rates from the standpoint of the monetary authorities.

    For the PPI excluding energy inflation is up by 0.9%, Over 12-months it rises at a slower 0.7% annual rate over six-months and the PPI excluding energy falls by 0.3% over 3-months. The contained status of headline inflation is thus translated into the core so that the sequential core pattern shows inflation progressively lower measured over longer to shorter periods. For the German economy, its good news from the standpoint of inflation although part of the cost of this is that the German economy has been exceptionally weak.

    The details of the PPI are a little bit less interesting because they're not seasonally adjusted, however, consumer goods, investment goods, and intermediate goods, trends are working lower.

    Comparing the PPI to the CPI - and to the CPI excluding energy - we see that the excellent PPI trends do not translate directly into solid CPI inflation. CPI inflation is somewhat erratic but at 2.4% over 12-months and at 3% over three months, and the CPI ex-energy at 2.6% over 12-months and much higher at 3.4% at an annual rate over three-months, the German CPI has more work to do.

    Still the underpinning of a solid PPI report is reassuring. With Brent oil prices off by about 7% over 12-months and falling at a 15% annual rate over three-months, the beneficial inflation trend is being driven by weakness in oil prices. And that does help the PPI more and faster than the CPI.

  • Europe
    | Oct 15 2025

    EMU IP Sinks in August

    Industrial output in the European Monetary Union fell by 1.2% in August after rising by 0.5% in July. Manufacturing output followed these trends as well, falling by 1.2% in August after rising 0.8% in July. Sequential growth rates from 12-months to six-months to three months show a deteriorating trend with 12-month growth up by 0.5%, six-month growth falling at a 1.6% annual rate, and three-month growth falling at a 5.9% pace. Manufacturing largely follows the same pattern with a 12-month increase of 0.8%, a six-month decline at a 1.2% annual rate, and a 3-month decline at a 5.1% annual rate.

    In the quarter to date, both overall industrial production and manufacturing industrial production are falling.

    Turning to sectors, most sectors posted declines in August with the exception being consumer nondurables where there was an increase in output of 0.1%. This is in sharp contrast to July where, despite a small increase in output, there were increases in output for manufacturing and for overall for consumer goods as well as strength for consumer durables. Consumer nondurables, intermediate goods, and capital goods in July revealed a very good month. However, industrial production was following that up with an August that is unwinding most of that rebound. However, for June, the month prior to July, they also had widespread declines with declines in every single sector except intermediate goods where output was flat. These conditions leave us with trends for manufacturing that are decelerating as noted above led by decelerations in consumer goods output. Intermediate goods and capital goods break with this pattern as intermediate goods show declines over 12 months and six months but log that 0.9% increase in output over three months; for capital goods there are declines in output over 12 months and over three months with the sharp decline over three months in between over six months there was a very small increase of 0.4%.

    The final column presents year-to-date percentile standings based on 12-month growth rates. The overall growth rate for industrial production as well as manufacturing log rankings only in their 40th percentile, below their respective median for the period. Consumer goods, however, log a strong increase and post a 95th percentile standing, led by a 95.9 percentile gain for consumer nondurables. Capital goods, an important sector for the monetary union, has only a 27.5 percentile standing.

    Across countries- Rankings for manufacturing across countries are also relatively weak with 7 of 13 of the country's logging rankings that are below their 50th percentile; Spain, Austria and Belgium have rankings above their 45th percentile putting them closer to a ranking that would be a median ranking that occurs at the 50th percentile mark. Two of the countries with increases above, but it's also true that 50th percentiles have only a 50.9 percentile and a 51.8 percentile standing and those countries have France and Italy. Luxembourg shows the manufacturing sector with growth in its 95.9 percentile. Ireland and Portugal post growth rates in their 80th percentile with Malta posting with growth rate in a 71.6 percentile. There's no significant strength in any country with size in the monetary union.

    Finally, on a quarter-to-date basis, eight of the countries show declines with two months of data for the quarter.

    This report continues the string of disappointing reports for growth and industrial output. The monetary union report shows little to spur optimism.

  • Manufacturing trends in the European Monetary System in August were mixed. Among the 13 countries reporting early industrial production data, six reported output declines.

    Looking at the three most recent months of data, June, July, and August, there are four countries that are showing growing weakness month-to-month for each of those three months. Those are Austria, Belgium, France, and Greece. Only two countries are showing steady acceleration over the span; those are Ireland and Portugal.

    Looking at sequential data, growth over 12 months, six months and three months, progressive weakening is seen in four countries Germany, Spain, Ireland, and Portugal that compares to acceleration in Belgium, France, and the Netherlands. In terms of Monetary Union nonmember countries, Sweden is showing persistent acceleration while Norway is showing persistent but very moderate deceleration.

    These data are rife with contradictions as no accelerating/decelerating trend sequentially persists over the next three months in the same direction. The European Monetary Union is clearly in a period of transition in terms of growth and conditions have been weak and are not yet breaking out to the upside. What this tells us is that a period of acceleration has not yet stepped up and weakness, even deceleration has lingered. Quarter-to-date data show us that there are output declines in most of these economies with only five EMU Members showing output growing in the quarter-to-date period.

    This continues to be part of an extended period in which industrial output has been extremely weak: we can support that with the numbers. Looking at these 13 members, we assess the ratio of industrial production today compared to where it was in January of 2020 before COVID struck and before the Russian invasion of Ukraine. This comparison goes back 5 1/2 years; Germany, France, Italy, Spain, Luxembourg, and Portugal all have levels of output today in terms of manufacturing output that are lower than they were in January 2020. This is a very long period to go without having output recover to its level in January 2020.

    Separately the table ranks countries on growth rates, This ranking is a ranking of output growth on 12-months rates over data since 2007. On that basis, seven of the countries in the table have year-over-year growth rates below the median growth that they had during this period back to 2007. That's slightly over half of the monetary union countries in the table that are reporting growth rates below their median for this extended period of 20 years, much of it delivering very weak growth.

    Hope springs eternal, for a manufacturing rebound. Central banks right now are trying to run relatively accommodative policies and are tolerating some inflation overshooting to do that; however, it doesn't appear to have been enough to excite any acceleration in manufacturing output. Europe continues to be challenged in terms of manufacturing growth. There is really nothing in these data that make us optimistic that conditions are getting better.

  • Germany shows signs of withering domestic demand in the face of weaker foreign demand. German exports weakened in August, falling by 0.5% month-to-month. The drop in German exports to the U.S. was being highlighted at a 2.5% month-to-month decline, but its exports to EMU members were down by 2.2% as well and exports to non-EMU members of the EU were lower by 3.1%. In fact, German exports outside the EU area rose by 2.2% largely on exports to China.

    Exports to the U.S. vs. European trends The German website highlights a large drop in German exports to the U.S. from August 2024, a period over which German exports to the U.S. are off by some 20%. This is a much sharper drop than the German overall result that shows a decline of less than 1% over the past year for total exports. However, on the near-term comparison, German exports to the U.S. seem to be behaving a lot like German exports to its closer European neighbors.

    World trade The Baltic dry goods index shows a sharp recovery in world trade volume (in dry goods; excluding tanker volumes) from a dip in early-2025. From early 2025 to date, trade volume readings on the Baltic index are among some of the stronger readings since 2022.

    German orders imports, demand German orders data had also flagged weakness in external orders. Overall orders show weakness, but domestic orders remain strong and are accelerating. Still, the recent (August) IP report showed declines on the month and growing output weakness - despite strong domestic real orders. In today’s trade report, we are seeing some weakness in Europe and among the EU’s non-EMU members plus trade weakness with the United States. This is partly compensated for by strength elsewhere and a part of that is German exports finding some demand in China. All the geographical references are up to date through August.

    Overall German trade patterns However, German overall trade showing German domestic import strength with real and nominal imports rising solidly and even strongly over 12 months and six months but giving some ground over three months. German nominal and real export trends are showing some growth except over three months but at that, the pace generally is weaker than the pace for imports.

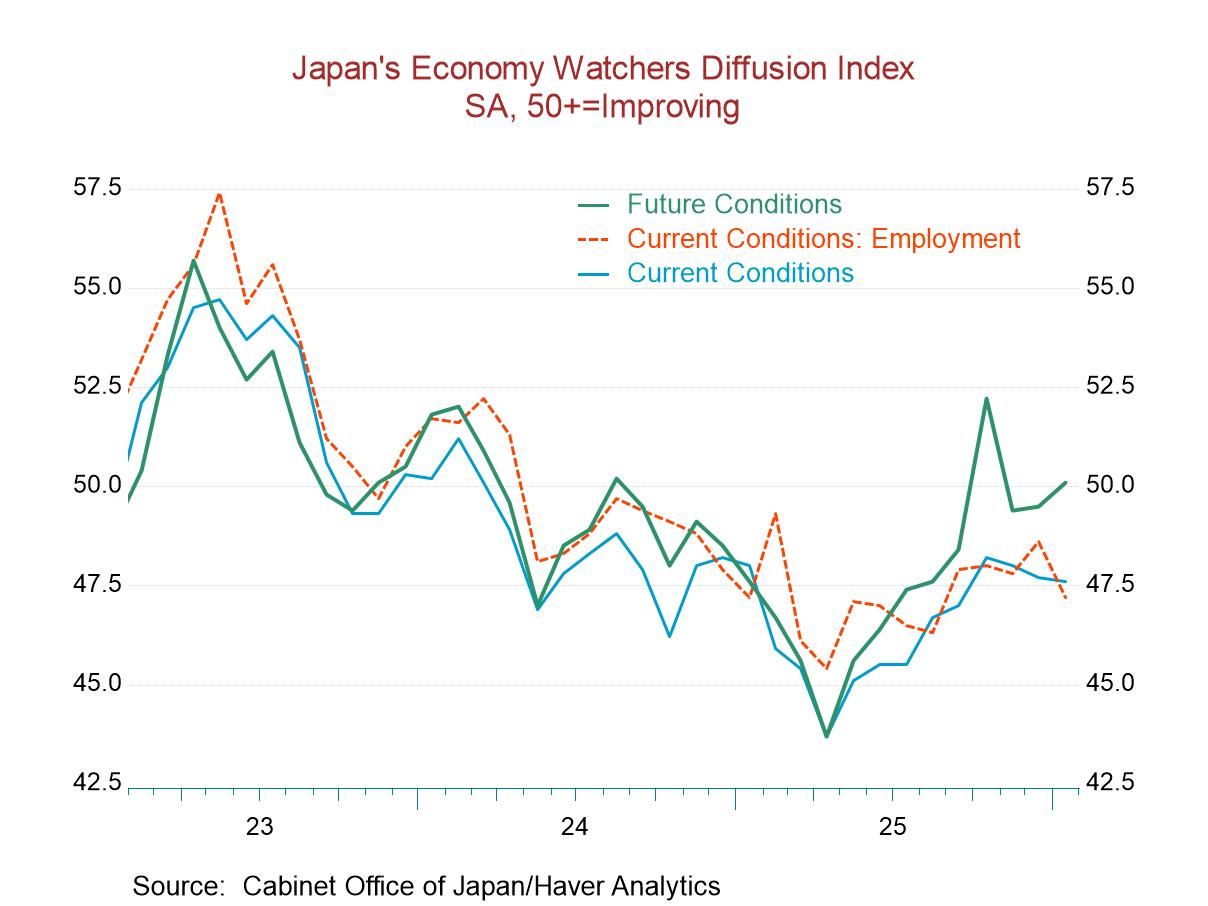
  • Japan's economy watchers index in September advanced to 47.1 with the future index rising to 48.5. The current index rose month-to-month by four-tenths of a percentage point while the future index rose by a full diffusion point.

    The Current Index In September, among the 9 detailed categories, all but three of them improved in the current index, in August all but two had improved, and in July all but four had improved.

    Sequential changes- The sequential changes on the current index shows that over three months the headline and all components improved, over six months the headline and all components also improved, but over 12 months only two components improved and the headline falls back by about nine-tenths of one-point. Improving over 12 months are only the assessments for services and for housing

    Rankings- The ranking statistics for the current index show only two components below a rank-value of 50%, which means only two components are below their respective medians on data back to 2004. However, the current readings show the headline and all components below diffusion values of 50 in September, indicating contraction both overall as well as in each category. This combination of observations is a stark reminder of how weak Japan’s economy has been, that contracting diffusion values are above their medians. In the case of housing with a 73.5 percentile standing – a standing that, on its own seems quite solid, corresponds to a monthly diffusion value at 49. Housing diffusion has been stronger than a diffusion value of 49 only about 27% of the time (over the past 21-years).

    The Future Index The future responses are similar in nature to the current responses. Recent diffusion values have mostly been improving monthly. Only two were weaker in September, compared to four in August and none in July. The future index, however, has two September readings above diffusion values of 50: for eating & drinking places and for nonmanufacturers. In August services read above a 50 diffusion value (even as the weaken month-to-month) and in July three component responses are above 50.

    Sequential changes- Over three months all components improve except employment; that result is replicated over six months. Over 12 months only three categories are improving: eating & drinking, housing, and nonmanufacturing.

    Rankings- Only two sectors rank below 50% (below their respective medians) in September; those two are services and employment expectations). The headline standing is above 50% at 50.2%, unlike for the current reading where the headline standing is at 48.2%. However, we once again see that 5 sector readings in the future survey have diffusion values in September below 50 but are above their respective medians. The same is true of the headline for the future index. The median phenomenon has been a moderate contraction over the last 21 years.

  • German orders fell by 0.8% in August, dropping for four months in a row. Foreign orders have been and continue to be chronically weak. Domestic orders that made a strong rebound in the month have been erratic in recent months although they seem to be on a recovery path.

    Total German factory orders are sequentially weakening on growth of 1.6% over 12 months, 0.5% annualized over six months and logging an annual rate of decline of 14.2% over three months. This path is largely driven by foreign orders that are weakening progressively and sharply. Foreign orders rise by just 0.4% over 12 months, then fall at a 1.6% annualized pace over six months and collapse at an annualized rate of -31.2% over three months. In contrast, domestic orders engage a moderate accelerating path that is topped off by extremely strong growth. Domestic orders rise by 3.4% over 12 months and at a slightly stronger 3.7% pace over six months and accelerate to 20.8% annualized over three months.

    Quarter-to-date overall and foreign orders are declining with domestic orders following suit. Foreign orders show substantial contraction in the quarter while domestic orders contract at a much less violent pace.

    Rankings as an order-vetting process If we further vet orders by their levels, a weak judgement-standard over such a span even for ‘real’ orders, rankings on levels since 1990 show foreign orders at the 70% mark and domestic orders at a quite weak 35-percentile. However, rankings based on year-over-year growth rates drop the foreign order ranking to 38.5%, below their median and raise domestic orders to their 61.9 percentile. Total orders ranked by growth have a 49.2 percentile standing, nearly a median ranking; while total orders ranked on levels have a 58.4 percentile standing.

    Real sales Real sales for manufactured goods, viewed sequentially, show mixed trends with manufacturing overall having no clear tendency other than that of slight contraction. Consumer durable goods orders show accelerating contraction. Other categories are without clear trend. Quarter-to-date most categories show contraction in the quarter. Levels of real sales rankings show an above-median 50.7% for all of manufacturing boosted by capital goods with a 69.7 percentile standing and supported by intermediate goods with a slight under median 47.1 percentile standing. Consumer goods sales standings are extremely weak. But sales based on growth rates (12-months) show rankings below 50% for all sales categories – most are at the one-third mark.

    EMU industrial confidence in large countries Industrial confidence metrics for the four largest EMU member economies show broad weakening in August except for France; but all of the countries had improved industrial confidence in July. Sequentially the patterns are mixed for these four countries. Compared to year ago, values for two of them improved (France and Spain) while two other deteriorated (Germany and Italy). The queue standing on levels which are a fairer comparison on diffusion data (like this) show all readings below their 50-percentile mark (the median), with Germany at an anemic 12.9 percentile rank, the weakest of all and Spain at a 46.8 percentile ranking, the strongest.

    On balance, this is a disappointing report for Germany. Its domestic economy seems to be on the right track, but its key customer base in foreign markets appears to be struggling more. It’s a mixed view, at best.