Haver Analytics
Haver Analytics

Economy in Brief: March 2022

  • The U.K. CBI survey for March 2020 shows orders moving up to a net diffusion reading (up minus down) of 26 from 20 in February. That compares to a net of 24 in January. The January reading is above the three-month, six-month, and 12-month averages. It's a strong reading for orders and it shows that manufacturing in the U.K. is still carrying forward momentum. Export orders swung sharply higher in March moving to +7 from -7 in February. All the averages for prior periods, for three-months, six-months, and 12-months are negative values making the +7 reading for orders in March an extremely strong reading by recent standards. Stocks of finished goods improved to -8 in March from -14 in February; they too are stronger in March than they are over three-month, six-month and 12-month averages. Negative readings on stocks are quite common. Despite the pick-up in March, the index is still at a very weak level. For total orders, the queue standing is in the 99.7% (its highest reading on this timeline since 1991). Orders have never been higher than they are in March. Export orders have a 92.3 percentile standing, also very strong. For inventories of finished goods, however, despite their improvement, there is a 2.5 percentage point standing. That means the reading for stocks has been weaker only about 2.5% of the time, marking March as an extremely low reading, despite its recent strength. In the U.K., firms continue to have a hard time building inventory. While the outlook for orders and export orders is solid and strong, firms are having a difficult time getting ahead of demand because of supply constraints and other problems.

    Other industrial measures While the industrial production measure lags and it's only up to date through January, industrial production has been generally accelerating. It’s up at 3.7% over 12 months, it's up at a 2.3% pace over six months, and then it accelerates, rising at a 7.2% pace over the last three months. Industrial production in manufacturing continues to show some solid strength. Also, the PMI measure from Markit for the U.K. continues to float at a high level between 55 and 60. Its standing for February is at its 84th percentile; that's a relatively strong reading for U.K. manufacturing.

    Outlook for volume and prices The outlook for volume of output over the next three months ticked slightly lower in March, turning in a reading of 30 from February’s 31. However, the reading of 30 is still affirmed as a strong reading; it's above the three-month average of 28 and the six-month average of 29 and just below the 12-month average of 31. The percentile standing of this reading of 30 has a 95.1 queue percentile standing. Even though the March reading is only at this 12-month average, it's at what is historically a very strong reading for expected output. Average prices have moved up strongly in March to a reading of 80 from 77 in February and 66 in January. Here are the averages are quite telling: the 12-month average for prices three months ahead has a net rating of 54, that steps up to 69 over six months and steps up again to 74 over three months. Expectations for inflation continue to leapfrog. The March percentile standing for prices at 80 is in the 99.7 percentile mark. This is the highest reading for expected prices since at least 1991.

    • Gasoline prices partially reverse earlier gain.
    • Crude oil prices fall sharply.
    • Natural gas prices slip.
  • German inflation rose sharply in February, gaining 1.4% after rising 1.9% in January and 5.1% in December. These are increases month-to-month for the German ‘headline PPI,' the PPI excluding construction; they are exceptionally large month-to-month gains. The German PPI excluding energy rose by 1% in February following a 2.2% gain in January and a 0.6% gain in December. The heat is on…

    Sequential prices growth Over three months the headline PPI series is up at a 38.8% annual rate; over six months it's up at a 35.8% annual rate; over 12 months it rises at a 25.9% annual rate. These statistics show a slight acceleration for inflation with inflation running at an extremely rapid pace. Inflation data continue to be quite unsettling. For the PPI excluding energy, inflation is up at a 16.5% annual rate over three months; that's an acceleration from 12.5% over six months and a nearly identical 12.4% rise over 12 months. The inflation measure excluding energy is also extremely high and indicates that inflation is entrenched quite beyond the impact of energy on headline inflation.

    Quarter-to-date PPI In the quarter-to-date, the PPI headlines series is running at a 34.3% annual rate of increase at this point; that reflects the January plus February PPI indexes divided by the fourth quarter index average annualized. Calculated the same way, the German PPI excluding energy is up to 17.3% annual rate. Both are quite strong gains and certainly out of the tolerance range for the central bank. They contribute to the view that inflation not only remains problematic but that the problem is worsening.

    Compared to the CPI However, the European Central Bank looks at consumer price inflation, particularly at its HICP measure. In Table Germany's PPI, we have chronicled the behavior of the German domestic CPI as a point of reference. The CPI shows much smaller increases than the PPI but still strong increases and a demonstration of acceleration. The headline CPI is up at a 7.4% annual rate over three months; that accelerates from 6.7% over six months and that's up from 5.2% over 12 months. The German CPI excluding energy is up to a 3.7% annual rate over three months, compared to 3.5% over six months and a 3.2% pace over 12 months. Again, these are excessive rates of inflation compared to a target of 2% by the ECB for overall EMU inflation.

    Quarter-to-date CPI The CPI gains are not as outlandishly strong as the PPI inflation figures show. But in the quarter-to-date, inflation is unfolding rapidly; the CPI is up at 8.5% annual rate and the CPI ex-energy is up at a 4.3% annual rate. Inflation continues to accelerate and to be stubborn at extremely high rates of inflation.

    • Three of four components improve.
    • Three-month moving average eases.
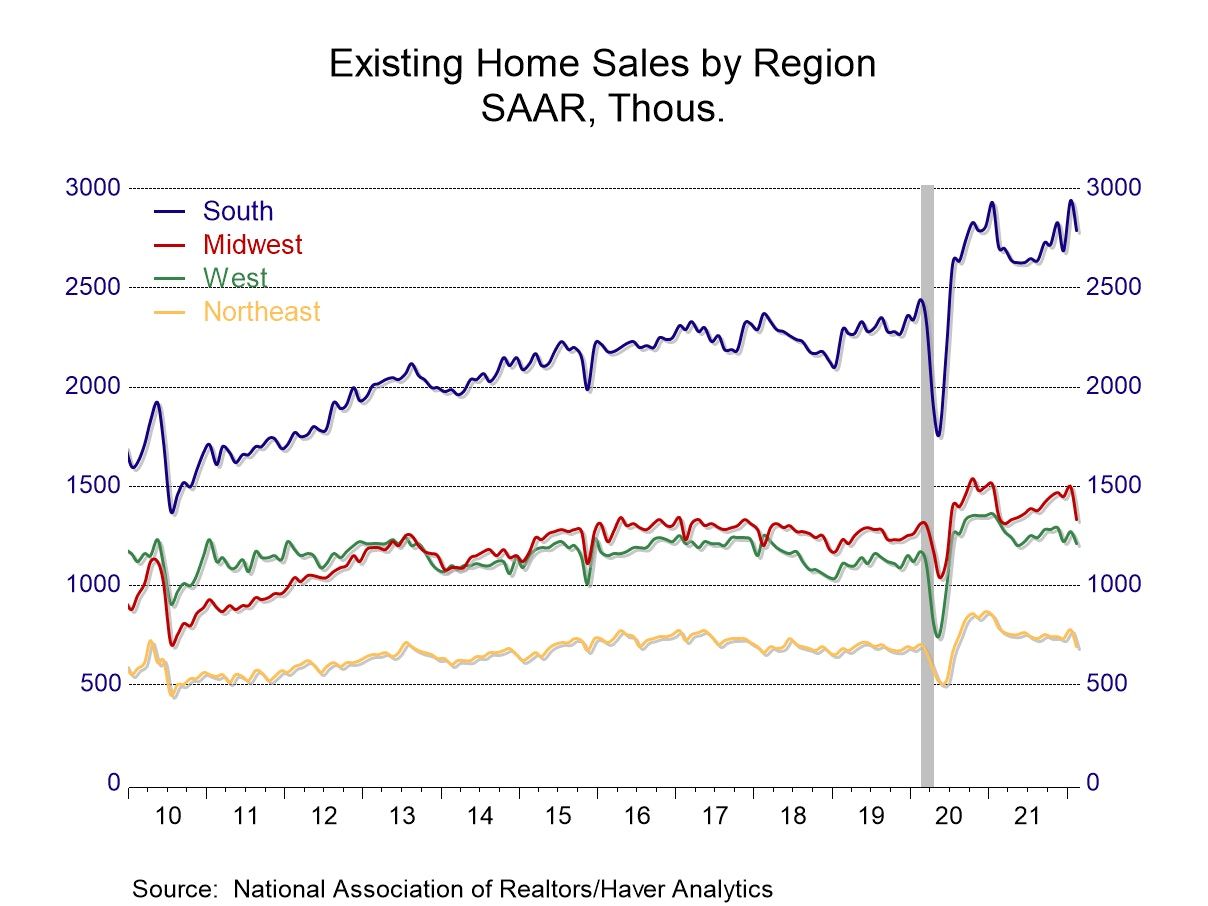
    • Sales drop follows January increase.
    • Declines are spread throughout country.
    • Median price gain reverses earlier decline.
  • After logging a long string of current account surpluses, the countries of the European Monetary Union (EMU) have now posted three deficits in a row for consecutive months. The turnaround is on the back of sharply increased imports which reflect increased imports of nonmanufactured goods. Commodity prices have increased sharply, and this has driven up the deficit for nonmanufacturers across the EMU.

    The balance of trade on manufactured goods posted a surplus of €29.1 billion in the 12-month period ended 12-months ago. In the current 12-month period the surplus is €28.3 billion, a slightly smaller amount, but not much changed. Yet, for nonmanufactured goods, the 12-month average for 12 months ago was a deficit of €8.8 billion; that figure has ballooned to €21 billion on average over the last 12 months and has escalated to €30.4 billion in deficit on average over three months and progressed further to a deficit of €33.2 billion in January alone. All those figures are expressed at annual rates.

    The point is that manufacturing in Europe seems to have held up well; however, it has not been able to keep pace with the sharp increase in nominal nonmanufacturing goods and a deficit has been created as a result. This is a deficit caused by the increased importation of nonmanufactured goods and substantially a deficit caused by the increase in the prices of nonmanufactured goods.

    Looking at percentage changes, manufactured goods imports are up by 26.4% over 12 months but nonmanufactured goods imports are up by 82.6% over 12 months. For exports, manufactured exports are up by 12.8% over 12 months while nonmanufactured exports are up 30.5% over 12 months. Clearly the trade action has been concentrated in around nonmanufactured goods, not in manufactured goods. But manufactured goods have nonetheless held their ground.

    Looking at the results for individual countries in Europe, Germany shows consistently faster import growth than export growth over 12 months, over six months and over three months. France shows an uneven picture with exports and imports trading places as far as which flow is expanding more rapidly. Over 12 months French exports grow faster than French imports and that trend holds up over three months as well, although it is reversed in each of the last two months. The U.K. has stronger imports than exports with imports up 23.5% over 12 months and exports up by just 11.4% on that timeline; exports are up at a 6.1% annual rate over three months with imports up at a 28.2% annual rate over three months.

    • Component changes in leading index are mostly positive.
    • Coincident indicators continue to strengthen.
    • Lagging indicators hold steady after five straight increases.
  • Inflation in the European Monetary Union (EMU) rose by 0.7% in February after rising by 1.1% in January. The core measure for inflation (excluding food and energy) in February rose by just 0.1%; that was after rising by 0.7% in January. Sequential growth rates that measure inflation over 12 months, six months and three months show inflation has been building momentum for the headline inflation rate which expanded by 5.8% over 12 months, at a 7.9% annual rate over six months and at an 8.9% annual rate over three months.

    The core rate of Inflation breaks this string of acceleration but only technically. The 12-month core gain is at 2.6%; that rises to a 3.9% annual rate over six months and that in turn backs off very slightly to log a technically smaller gain at a pace of 3.8% over three months. Essentially inflation has gone from being excessive over 12 months to being much more excessive over three months and six months according to each of these measures.

    The ECB is well away from its target of hitting 2% inflation although as we're going to see in the averages for inflation how much better-behaved much of this inflation phenomenon is when averaged. Inflation has really welled up relatively recently although it's quite excessive and now it still has momentum.

    Moreover, inflation is gaining momentum and from different sources. Oil prices are still extremely high in February. But Brent oil prices measured in euros fell 28.2% in February after rising by 14% in January. Oil prices remain high and the impact on inflation is still something to worry about because in global markets oil continues to hover at very high levels. Also, Europe has an economic 'IV' line for energy that is piped in from Russia making it dependent on the very country on which they have slapped aggressive economic sanctions. And to follow that thought… since Russia is walled off from global markets by sanctions, at some point it may find oil revenues as not as valuable as cutting off the oil flow and inflicting economic pain on Europe.

    In several ways the war in Ukraine is a factor...

    Before the war welled up, there were supply chain problems created by the pandemic (remember the pandemic?) and these supply chain issues were affecting prices globally, creating shortages, creating price pressures, and that now is made worse by having a war in Ukraine and having these countervailing sanctions placed on Russia.

    Russia is rich in natural resources and with the West putting sanctions on Russia, Russian commodities are going to be unavailable to the world and this is going to be reflected in higher commodity prices. The invasion of Ukraine is taking Ukraine off the map as an international trading partner and that of course is going to hit the food market and wheat market particularly hard as well as the market for selected natural resources. The implication here is that inflation is high, inflation has momentum, and inflation has some new sources that are going to make it worse before things get better.