Haver Analytics
Haver Analytics

Introducing

Robert Brusca

Robert A. Brusca is Chief Economist of Fact and Opinion Economics, a consulting firm he founded in Manhattan. He has been an economist on Wall Street for over 25 years. He has visited central banking and large institutional clients in over 30 countries in his career as an economist. Mr. Brusca was a Divisional Research Chief at the Federal Reserve Bank of NY (Chief of the International Financial markets Division), a Fed Watcher at Irving Trust and Chief Economist at Nikko Securities International. He is widely quoted and appears in various media.   Mr. Brusca holds an MA and Ph.D. in economics from Michigan State University and a BA in Economics from the University of Michigan. His research pursues his strong interests in non aligned policy economics as well as international economics. FAO Economics’ research targets investors to assist them in making better investment decisions in stocks, bonds and in a variety of international assets. The company does not manage money and has no conflicts in giving economic advice.

Publications by Robert Brusca


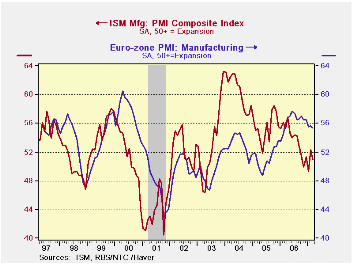
  • As you can tell from the chart on the left the sense of there being separate business cycles in the US and in Europe is a sort of joke. The US and Euro area manufacturing indexes are plotted on top of one another and their sense of co-variation is unmistakable. Also the US is shown to be the male and E-zone is the female; that is to say, if we regard this as a dance, the US leads.

    In the recent mini-cycle, Europe has struck out a bit on its own. A US up-cycle from mid-2005 aborted early, turning to decline. Meanwhile, Europe has continued to expand and only recently has hit a plateau with hint of erosion. In the US, the down-cycle is only showing early signs of stabilization.

    yes"> We wonder if Europe needs the US more than the US needs Europe?

    The table above shows hath the E-zone readings, while off peak, are still very high in the range they have occupied since Mid-1997. The overall index is in the top 30% of its range and stands 6% above its average. Orders are similarly strong. Supplier deliveries are showing the weakest relative performance 10% below their average of the period.

            Placing NTC Euro-Zone Readings in their Respective Ranges
     Since June'98
    NTC E-zoneCurrentStd DevAverageSD% AvgMAXMINRangePercentile% of AVG
    NTC Index55.43.852.57.360.542.917.571.1106
    New Orders56.44.653.58.762.441.021.472.3105
    Backlogs53.93.152.05.957.647.210.564.1104
    Production57.44.254.27.762.843.019.972.8106
    Supplier Deliveries42.54.847.210.156.934.722.235.190
    Inventories48.71.048.32.050.446.24.358.9101
    Prices (Pd)66.19.859.716.476.537.738.873.3111
    Employment52.92.949.85.856.044.211.873.9106
    New Export Orders55.34.352.88.160.039.420.677.5105
    Note: From June 1997 to Date; except back logs since Nov '02

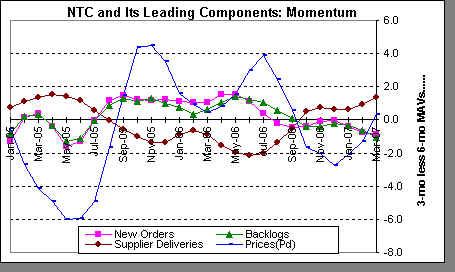
    The leading components of the NTC E-zone index are showing mixed trends. We form these trends as the difference between the 3 month and six month indexes. Supplier deliveries and prices-paid are turning up while new orders and order backlog trends are eroding.

    On balance, we can see the strong US-Europe linkages or commonalities. The history looks as though the US cycle gets transmitted to Europe, but Europe is recently showing some independent strength. However, it is also showing some sign of decay. It hardly seems as though a further rise in the Euro can do any good for Europe. But, so far so good.
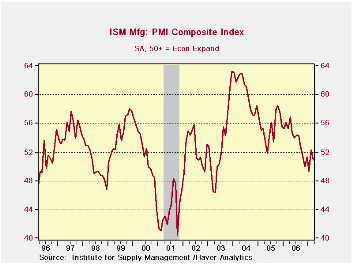

  • The chart on the left shows the ISM clearly has broken through the up trend from its recession recovery and now is in a well-established downtrend. Its recent up-tick is still in the grip of that down-trending range. The table below shows the ISM and its components with a number of statistics that describe it/them. A quick perusal of the table shows why I like to evaluate the ISM by looking at the values in the LAST TWO columns instead of seeing if the index is above 50 (Rising) or below it (Falling). Each of these ISM components has a different range variability characteristic, range of values and mean. Even with the ISM above 50, as it is this month, it is still only in the 46th percentile of its range and at 96% of mean.
    Only inventories, prices and the trade-related components are above their mean values. Employment, at 99% of its mean, is nearly there.

    So while the ISM indicates expansion in the lexicon of the ISM we can see it is indeed a still wounded report that shows manufacturing is not yet up to par.Commentary Archive


  • The chart on the left shows the ISM clearly has broken through the up trend from its recession recovery and now is in a well-established downtrend. Its recent up-tick is still in the grip of that down-trending range. The table below shows the ISM and its components with a number of statistics that describe it/them. A quick perusal of the table shows why I like to evaluate the ISM by looking at the values in the LAST TWO columns instead of seeing if the index is above 50 (Rising) or below it (Falling). Each of these ISM components has a different range variability characteristic, range of values and mean. Even with the ISM above 50, as it is this month, it is still only in the 46th percentile of its range and at 96% of mean.
    Only inventories, prices and the trade-related components are above their mean values. Employment, at 99% of its mean, is nearly there.

    So while the ISM indicates expansion in the lexicon of the ISM we can see it is indeed a still wounded report that shows manufacturing is not yet up to par.

                            Placing ISM Readings in their Respective Ranges
     Since June 1998
    ISMCurrentStd DevAverageSD%AvgMAXMINRangePercentile% of AVG
    PM Index50.95.353.210.063.240.522.745.896
    New Orders51.66.755.812.071.338.432.940.193
    Backlogs47.06.750.413.466.536.030.536.193
    Production53.06.355.711.470.038.631.445.995
    Supplier Deliveries51.35.054.29.268.145.422.726.095
    Inventories47.53.945.88.653.637.116.563.0104
    Prices (Pd)65.512.662.120.388.032.056.059.8105
    Employment48.75.949.312.060.335.125.254.099
    New Export Orders55.53.553.66.660.244.315.970.4104
    Import Orders57.53.654.66.661.546.914.672.6105
    Avg Days Lead For:Since June 1998
    Production Material45.03.247.16.955.038.017.041.296
    Capital Expenditure110.08.7107.18.1120.086.034.070.6103
    Maint., Repair, & Ops22.02.122.59.529.017.012.041.798
    Note: From April 1991 to Date; except back logs since Jan 1993

  • The chart on the left shows the ISM clearly has broken through the up trend from its recession recovery and now is in a well-established downtrend. Its recent up-tick is still in the grip of that down-trending range. The table below shows the ISM and its components with a number of statistics that describe it/them. A quick perusal of the table shows why I like to evaluate the ISM by looking at the values in the LAST TWO columns instead of seeing if the index is above 50 (Rising) or below it (Falling). Each of these ISM components has a different range variability characteristic, range of values and mean. Even with the ISM above 50, as it is this month, it is still only in the 46th percentile of its range and at 96% of mean.
    Only inventories, prices and the trade-related components are above their mean values. Employment, at 99% of its mean, is nearly there.

    So while the ISM indicates expansion in the lexicon of the ISM we can see it is indeed a still wounded report that shows manufacturing is not yet up to par.

                            Placing ISM Readings in their Respective Ranges
     Since June 1998
    ISMCurrentStd DevAverageSD%AvgMAXMINRangePercentile% of AVG
    PM Index50.95.353.210.063.240.522.745.896
    New Orders51.66.755.812.071.338.432.940.193
    Backlogs47.06.750.413.466.536.030.536.193
    Production53.06.355.711.470.038.631.445.995
    Supplier Deliveries51.35.054.29.268.145.422.726.095
    Inventories47.53.945.88.653.637.116.563.0104
    Prices (Pd)65.512.662.120.388.032.056.059.8105
    Employment48.75.949.312.060.335.125.254.099
    New Export Orders55.53.553.66.660.244.315.970.4104
    Import Orders57.53.654.66.661.546.914.672.6105
    Avg Days Lead For:Since June 1998
    Production Material45.03.247.16.955.038.017.041.296
    Capital Expenditure110.08.7107.18.1120.086.034.070.6103
    Maint., Repair, & Ops22.02.122.59.529.017.012.041.798
    Note: From April 1991 to Date; except back logs since Jan 1993
    A rose is a rose is a rose (Existentialism) Arroz es arroz es arroz (Rice is rice) MFG is MFG is MFG (The law of global linkages)
    by Robert Brusca April 2, 2007

    As you can tell from the chart on the left the sense of there being separate business cycles in the US and in Europe is a sort of joke. The US and Euro area manufacturing indexes are plotted on top of one another and their sense of co-variation is unmistakable. Also the US is shown to be the male and E-zone is the female; that is to say, if we regard this as a dance, the US leads.

    In the recent mini-cycle, Europe has struck out a bit on its own. A US up-cycle from mid-2005 aborted early, turning to decline. Meanwhile, Europe has continued to expand and only recently has hit a plateau with hint of erosion. In the US, the down-cycle is only showing early signs of stabilization.

    yes"> We wonder if Europe needs the US more than the US needs Europe?

    The table above shows hath the E-zone readings, while off peak, are still very high in the range they have occupied since Mid-1997. The overall index is in the top 30% of its range and stands 6% above its average. Orders are similarly strong. Supplier deliveries are showing the weakest relative performance 10% below their average of the period.

            Placing NTC Euro-Zone Readings in their Respective Ranges
     Since June'98
    NTC E-zoneCurrentStd DevAverageSD% AvgMAXMINRangePercentile% of AVG
    NTC Index55.43.852.57.360.542.917.571.1106
    New Orders56.44.653.58.762.441.021.472.3105
    Backlogs53.93.152.05.957.647.210.564.1104
    Production57.44.254.27.762.843.019.972.8106
    Supplier Deliveries42.54.847.210.156.934.722.235.190
    Inventories48.71.048.32.050.446.24.358.9101
    Prices (Pd)66.19.859.716.476.537.738.873.3111
    Employment52.92.949.85.856.044.211.873.9106
    New Export Orders55.34.352.88.160.039.420.677.5105
    Note: From June 1997 to Date; except back logs since Nov '02
    Tankan Survey Shows Overall Confidence Holding Steady: Business Confidence Declines in Large Japanese Manufacturing Firms, But Rises in Non Manufacturing Firms 
    by Louise Curley April 2, 2007

    The leading components of the NTC E-zone index are showing mixed trends. We form these trends as the difference between the 3 month and six month indexes. Supplier deliveries and prices-paid are turning up while new orders and order backlog trends are eroding.

    On balance, we can see the strong US-Europe linkages or commonalities. The history looks as though the US cycle gets transmitted to Europe, but Europe is recently showing some independent strength. However, it is also showing some sign of decay. It hardly seems as though a further rise in the Euro can do any good for Europe. But, so far so good.

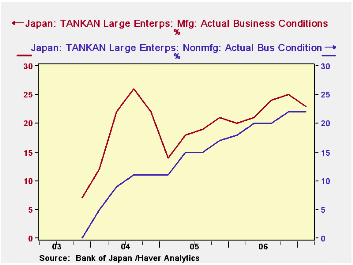
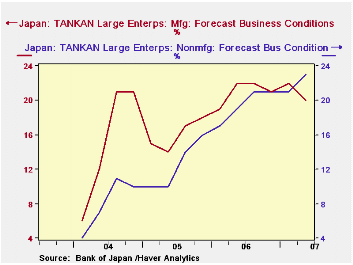
    Japan's Tankan released today showed that the headline large manufacturers' business condition DI (Diffusion Index) declined to 23% in March from 25% in December. These same firms forecast that the DI would decline further in June to 20%. The DI for non manufacturing large firms, on the contrary, remained steady in March at 22% and forecast that it would rise to 22% in June. The first two charts compare the actual results and forecasts for large manufacturing and non manufacturing firms.

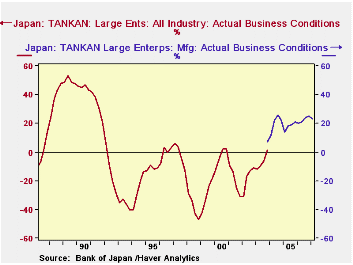
    As noted in the JAPAN data base, major revisions in the Tankan survey have created a discontinuity in the series beginning with the first quarter of 2004. The old series is maintained by Haver as a DISCONTINUED series. While the two series are not comparable, the old series is useful in that it provides some perspective in which we can judge the recent data. We have plotted the actual conditions of large manufacturing firms in the new and the DISCONTINUED series. While the recent data are less robust than those of the nineties, they are significantly above those of the decade or so of sub par Japanese economic activity, as shown in the third chart.

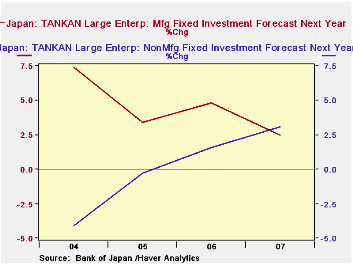
    Fixed investment expenditures by large manufacturing firms are forecast to increase more slowly, from 2.8% to 2.5%, in the current fiscal year; those by the large non manufacturing firms are set to increase 3.1% from 1.6% last year. The fourth chart shows in forecasted increases in fixed investment by large firms.

     JAPANESE TANKANQ2 06Q1 06Q4 05Q3 05Q2 05Q1 05
    Business Conditions Forecasts Large Firms (Percent Balance)
      Manufacturing202221222219
      Non Manufacturing232121211917
    Business Conditions Actual Large Firms Percent Balance
      Manufacturing --2325242120
      Non Manufacturing--2222202018
    Fixed Investment Expenditures
    % Change 
    2007200620052004
      Manufacturing4.43.44.82.5----
      NonManufacturing -4.1-0.31.63.1----
  • Construction Put In Place $-MillionsPercentage Change as Noted1-Mo1-Mo SAAR3-Mo6-MOYr/YrShareTotal0.3%3.3%-9.4%-4.8%-2.4%100.0%Private0.2%2.6%-18.1%-9.5%-6.0%75.5% Residential-1.0%-11.0%-31.2%-17.0%-15.1%48.0% [...]

  • Consumer Spending And Income TrendsStart of Q4Percentage changes at annualized rates: various horizonsInflation-adjustedOne monthThree monthsSix monthsOne [...]

  • Consumer Spending And Income TrendsStart of Q4Percentage changes at annualized rates: various horizonsInflation-adjustedOne monthThree monthsSix monthsOne [...]

  • Corporate profits with capital consumption adjustment fell by 0.3% in Q4 2006. Profits had risen by 3.9% in Q3 2006. The drop off comes as corporate executives have been warning of a pending earnings slowdown.

  • GDP GROWTH2006 Q12006 Q22006 Q32006 Q42006 Q42006 Q4 
    Actual/A,P,FActualActualActualAdvancePrelimFinalYr/Yr
    Real GDP5.6%2.6%2.0%3.5%2.2%2.5%3.1%
    PCE4.8%2.6%2.8%4.4%4.2%4.2%3.6%
    Durables19.8%-0.1%6.4%6.0%4.4%4.4%7.4%
    Nondurables5.9%1.4%1.5%6.9%6.0%5.9%3.7%
    Services1.6%3.7%2.8%2.9%3.3%3.4%2.9%
    Business Invst.13.7%4.4%10.0%-0.4%-2.4%-3.1%6.0%
    Structures8.8%20.3%15.7%2.7%-0.8%0.9%11.2%
    Equipment15.6%-1.4%7.7%-1.8%-3.1%-4.8%4.0%
    Housing-0.3%-11.1%-18.6%-19.2%-19.1%-19.8%-12.8%
    Inventories($B)*$41.2$53.7$55.4$35.3$17.3$22.4$35.4
    Farm$4.3$1.9$2.5$2.1$2.4$2.4$1.5
    Nonfarm$36.8$52.2$53.3$33.4$14.6$20.0($24.8)
    Net Exports($B)**($636.6)($624.2)($628.8)($581.4)($585.1)($582.6)$54.0
    Exports14.0%6.2%6.8%10.0%10.5%10.6%9.4%
    Imports9.1%1.4%5.6%-3.2%-2.2%-2.6%3.3%
    Government4.9%0.8%1.7%3.7%3.3%3.4%2.7%
    Real Final Sales5.6%2.1%1.9%4.2%3.6%3.7%3.3%
    For Yr/Yr: * average, ** Change from Yr ago Qtr    

    GDP and its main components are displayed in the table above. The most recent four quarters appear in the table as well as the three passes at estimating GDP in the current quarter and the current Yr/Yr value. GDP is still growing by more than 3% Yr/Yr.<span style="mso-spacerun:

    yes"> Q4 GDP�s estimate has fluctuated starting out at 3.5% dipping to 2.2% and now finalizing at 2.5% - that is we call this the final estimate for GDP. It is until benchmark revisions are done. In some sense GDP is never really finalized, but we call this the final estimate. The final estimate was made stronger mainly due to stronger inventory growth and weaker imports. Since imports subtract from GDP, weaker imports boost GDP. But imports are a function of the strength of domestic demand. So, weaker imports also are an indication of weaker domestic demand conditions. The slippage in capital spending in the final estimate on equipment and software is another example of fundamental weakness that is obscured by the upward revision to GDP in 2006-Q4. On balance, after revision, GDP is stronger but its trend looks weaker.

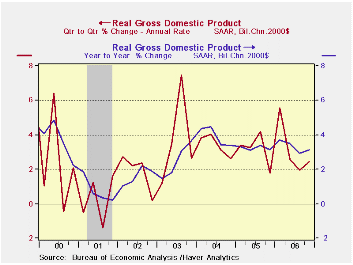
    The chart on the left contains the Q/Q as well as the Yr/Yr plot for GDP to show trend and volatility. On it you can seen that GDP growth is still gradually eroding, but amid enough volatility to make the trend less than certain.
    The GDP report highlights the recent statement made by the Fed Chairman about how the outlook has become more uncertain. While this report shows strong consumer spending, the consumer has been sluggish early in 2007, business investment is much weaker than expected, too. Inventories are in an irregular downtrend. A contracting (real) trade deficit, made up of firm exports and withering imports, has added strength to an otherwise lackluster economy. As we look ahead, it is clear that the economy needs a pick-up from some sector. Certainly the consumer must do better. But with housing askew the economy can ill afford for the business sector to be a drag on growth. Yet that is precisely what appears to be in train for the first quarter.

  • GDP GROWTH2006 Q12006 Q22006 Q32006 Q42006 Q42006 Q4 
    Actual/A,P,FActualActualActualAdvancePrelimFinalYr/Yr
    Real GDP5.6%2.6%2.0%3.5%2.2%2.5%3.1%
    PCE4.8%2.6%2.8%4.4%4.2%4.2%3.6%
    Durables19.8%-0.1%6.4%6.0%4.4%4.4%7.4%
    Nondurables5.9%1.4%1.5%6.9%6.0%5.9%3.7%
    Services1.6%3.7%2.8%2.9%3.3%3.4%2.9%
    Business Invst.13.7%4.4%10.0%-0.4%-2.4%-3.1%6.0%
    Structures8.8%20.3%15.7%2.7%-0.8%0.9%11.2%
    Equipment15.6%-1.4%7.7%-1.8%-3.1%-4.8%4.0%
    Housing-0.3%-11.1%-18.6%-19.2%-19.1%-19.8%-12.8%
    Inventories($B)*$41.2$53.7$55.4$35.3$17.3$22.4$35.4
    Farm$4.3$1.9$2.5$2.1$2.4$2.4$1.5
    Nonfarm$36.8$52.2$53.3$33.4$14.6$20.0($24.8)
    Net Exports($B)**($636.6)($624.2)($628.8)($581.4)($585.1)($582.6)$54.0
    Exports14.0%6.2%6.8%10.0%10.5%10.6%9.4%
    Imports9.1%1.4%5.6%-3.2%-2.2%-2.6%3.3%
    Government4.9%0.8%1.7%3.7%3.3%3.4%2.7%
    Real Final Sales5.6%2.1%1.9%4.2%3.6%3.7%3.3%
    For Yr/Yr: * average, ** Change from Yr ago Qtr    

    GDP and its main components are displayed in the table above. The most recent four quarters appear in the table as well as the three passes at estimating GDP in the current quarter and the current Yr/Yr value. GDP is still growing by more than 3% Yr/Yr.<span style="mso-spacerun:

    yes">Q4 GDP�s estimate has fluctuated starting out at 3.5% dipping to 2.2% and now finalizing at 2.5% - that is we call this the final estimate for GDP. It is until benchmark revisions are done. In some sense GDP is never really finalized, but we call this the final estimate. The final estimate was made stronger mainly due to stronger inventory growth and weaker imports. Since imports subtract from GDP, weaker imports boost GDP. But imports are a function of the strength of domestic demand. So, weaker imports also are an indication of weaker domestic demand conditions. The slippage in capital spending in the final estimate on equipment and software is another example of fundamental weakness that is obscured by the upward revision to GDP in 2006-Q4. On balance, after revision, GDP is stronger but its trend looks weaker.

    The chart on the left contains the Q/Q as well as the Yr/Yr plot for GDP to show trend and volatility. On it you can seen that GDP growth is still gradually eroding, but amid enough volatility to make the trend less than certain.

    The GDP report highlights the recent statement made by the Fed Chairman about how the outlook has become more uncertain. While this report shows strong consumer spending, the consumer has been sluggish early in 2007, business investment is much weaker than expected, too. Inventories are in an irregular downtrend. A contracting (real) trade deficit, made up of firm exports and withering imports, has added strength to an otherwise lackluster economy. As we look ahead, it is clear that the economy needs a pick-up from some sector. Certainly the consumer must do better. But with housing askew the economy can ill afford for the business sector to be a drag on growth. Yet that is precisely what appears to be in train for the first quarter.

    U.S. Corporate Profits Head Lower Fast…
    by Robert Brusca March 29, 2007

    Corporate profits with capital consumption adjustment fell by 0.3% in Q4 2006. Profits had risen by 3.9% in Q3 2006. The drop off comes as corporate executives have been warning of a pending earnings slowdown.

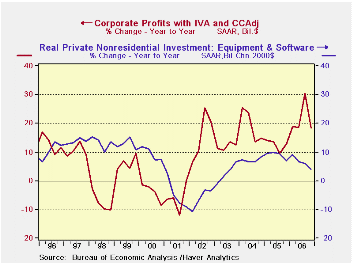
    Corporate profits are of course important for stock market investors. They also are important in determining the trend for capital spending. When profits slide corporations generally reduce capital spending. As the chart above shows, the current slowdown in capital spending is coming ahead of profits weakness. This is a worrying result since a number of earnings estimates just released point to a slowdown in the period ahead and capital spending is lower before that effect has hit the corporate balance sheet.

    Corporate Profits Accounting
     Q4-06Q3-06Q2-06Q1-06Q4-05
    Profits Pre Tax w/IVA & CCA18.3%30.6%18.5%18.9%12.8%
      Less Corp Tax12.2%29.5%21.2%14.0%33.5%
    Equals Profits after tax w/…… 21.0%31.0%17.4%21.0%5.7%
    Net Dividends11.7%11.4%11.1%11.1%-7.6%
    Undistributed Profits w/…… 36.2%68.8%26.9%36.1%38.2%
    Cash Flow
    Net Cash Flow w/……12.7%12.2%11.6%14.2%14.7%
      Undistributed profits w/……36.2%68.8%26.9%36.1%38.2%
      Consumption of fixed capital2.6%-6.4%4.6%4.5%6.9%
    Less IVA10.6%12.5%14.5%12.4%13.8%
    Equals Net Cash Flow10.6%12.5%14.5%12.4%13.8%
    Gasoline Prices "Spring Ahead"
    by Carol Stone March 29, 2007

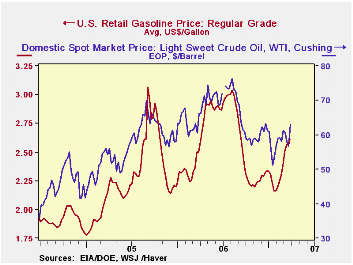
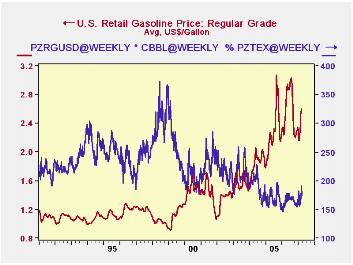
    Gasoline prices have started to rise again in earnest. In the week ended last Monday, March 26, regular gasoline was $2.61 a gallon, up 3.7 cents on the week and 22.7 cents from four weeks ago. From the same week a year ago, the price is up 4.8%. Some of the gain is seasonal, some may also be related to international political pressures on oil markets, and some purely supply-and-demand.

    On Tuesday, according to the BLS, the price of crude oil was $62.94 per barrel, up $6.20 from a low the week before and $1.47 from four weeks ago. Press reports this morning wonder if some recent firmness in oil relates to increasing tensions, particularly relative to Iran.

    Mid- to late-January had seen a nice break in these markets (at least from consumers' viewpoints), as gasoline was flirting with $2.00/gallon and crude oil fell near $50/barrel. In this period, demand was relatively low and inventories relatively high, as gauged by "days' supply" of gasoline inventory, seen in the second graph. In the days' supply measure, gasoline stocks are compared with the volume of product supplied. This "inventory/sales ratio" is an excellent illustration of the seasonal effect. The graph makes plain that these weeks in mid-winter are always a high point for gasoline availability. In the first week of February, the ratio peaked at 25.0 days, compared with annual averages just above 22 days for each of the last two calendar years. The graph also shows, however, that the whole range of inventory adequacy has declined in recent years; in 2001, that mid-winter peak was 26.3 days and in 1999, it was 29.1 days. Demand appears not to have weakened so much in the winter as it used to.
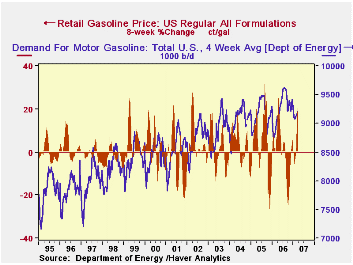
    This pattern is well reflected in the behavior of prices. We examined the change in retail gasoline prices over 8-week periods in the spring each year beginning in 1995. Through 2001, the wintertime weakness in prices tended to continue through March; in a couple of those early years, strength in March was followed by a pause in April and May. But beginning in 2002, the spring price surge was well in train already in March; this year, the 8-week span ending March 23 saw a gain of 20.6%, the second largest in the comparable periods of all of the past 13 years.

    Annual Averages
    GASOLINE PRICES & DEMAND3/26/073/19/072/26/071/23/073/27/06
    20062005
    Retail Price, Regular Gasoline, $/gal2.6102.5772.3832.1652.4982.5722.270
    Spot Price, West Texas Intermediate, $/bbl62.9456.7461.4753.9066.0866.1056.47
    Gasoline Demand
    (000 b/d, 4-wk Avg)
    9,2109,1789,1299,0909,0669,2599,146
    Inventory: Days' Supply22.822.924.124.723.822.422.0
  • What results from this is still a series of weak sector growth rates. The economy is not faring as badly as orders suggest because shipments are growing better than orders. Defense shipments are positive although have softened their [...]

  • What results from this is still a series of weak sector growth rates. The economy is not faring as badly as orders suggest because shipments are growing better than orders. Defense shipments are positive although have softened their [...]