 Global| Mar 30 2007
Goldilocks Meets Her Untimely Fate at the Hands of a Raucous Core PCE
Summary
Consumer Spending And Income TrendsStart of Q4Percentage changes at annualized rates: various horizonsInflation-adjustedOne monthThree monthsSix monthsOne [...]
| Consumer Spending And Income Trends | Start of Q4 | |||||
| Percentage changes at annualized rates: various horizons | ||||||
| Inflation-adjusted | One month | Three months | Six months | One Year | Q1/Q4 | Oct/Q3 |
| Consumption | 2.1% | 3.6% | 4.2% | 3.2% | 3.9% | 3.2% |
| Goods | -3.7% | 3.7% | 5.2% | 3.4% | 5.1% | 1.4% |
| Durable Goods | -1.2% | 6.9% | 7.5% | 5.3% | 9.2% | 5.3% |
| Nondurable Goods | -5.0% | 2.0% | 4.0% | 2.5% | 3.1% | -0.5% |
| Services | 6.2% | 3.8% | 3.6% | 3.2% | 3.3% | 4.7% |
| Consumer Income | ||||||
| Real DPI | 1.7% | 3.4% | 4.9% | 2.6% | 4.0% | |
| Per Capita | 1.0% | 2.6% | 3.9% | 1.6% | ||
| Memo: | Feb.07 | Three-Mos | Six-Mos | One-Year | ||
| Savings Rate (Pct) | -1.2 | -1.3 | -1.2 | -1.2 | ||
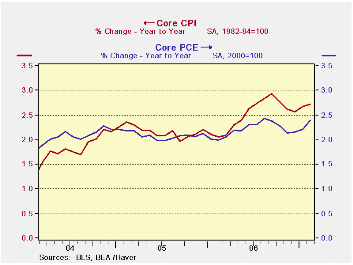 Is it too late for the PCE-flu vaccine? A simple perusal of the data (see the chart on the left) shows the PCE deflator skimming along the ceiling (did I say ceiling?) at a pace of 2%, plus or plus more. Now - don’t hold me to this - but if you look at the chart 2% looks suspiciously like a FLOOR not a ceiling for the PCE. You might carpet the floor but never the ceiling, what is the Fed up to? The Fed no sooner waters down its anti-inflation policy directive than inflation really does appear! What timing! Makes me wonder how Barney Frank feels after rubbing the Fed’s nose in its own statement of forecast and risk. Looks like the Fed got it both right and wrong (right risk; wrong policy sentence). For those who have forgotten, the policy portion of the Fed’s March statement is reproduced below. It has two parts, one that warns of the inflation risk (underlined) and another sentence that says the Fed is braced to do nothing about it (depends the evolution of...yadda, yadda, yadda)In these circumstances, the Committee's predominant policy concern remains the risk that inflation will fail to moderate as expected. Future policy adjustments will depend on the evolution of the outlook for both inflation and economic growth, as implied by incoming information.
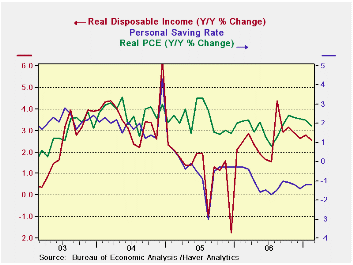 Looking at trends the economy seems on a more even keel that we might have thought. The other chart on the left shows that the simple Year/Year growth in spending is pretty stable (minor downward trend). And DPI (disposable personal income) is in a slow decay as well but not much different from stable. Income trends have rebounded from their contracting ways in early 2005. But the savings rate remains negative without any sign of change. Thus consumer spending is better underpinned by income growth than it was (still not fully, however, since sending growth is faster than income growth). And spending itself is reasonably firm with growth around 2%.
It’s a better picture than we thought we would have. U.S. Construction Also Rises…March 30, 2007By Robert Brusca
Looking at trends the economy seems on a more even keel that we might have thought. The other chart on the left shows that the simple Year/Year growth in spending is pretty stable (minor downward trend). And DPI (disposable personal income) is in a slow decay as well but not much different from stable. Income trends have rebounded from their contracting ways in early 2005. But the savings rate remains negative without any sign of change. Thus consumer spending is better underpinned by income growth than it was (still not fully, however, since sending growth is faster than income growth). And spending itself is reasonably firm with growth around 2%.
It’s a better picture than we thought we would have. U.S. Construction Also Rises…March 30, 2007By Robert Brusca| Construction Put In Place $-Millions | ||||||
| Percentage Change as Noted | ||||||
| 1-Mo | 1-Mo SAAR | 3-Mo | 6-MO | Yr/Yr | Share | |
| Total | 0.3% | 3.3% | -9.4% | -4.8% | -2.4% | 100.0% |
| Private | 0.2% | 2.6% | -18.1% | -9.5% | -6.0% | 75.5% |
| Residential | -1.0% | -11.0% | -31.2% | -17.0% | -15.1% | 48.0% |
| Lodging | 2.6% | 35.8% | 46.2% | 20.9% | 45.4% | 1.9% |
| Office | -0.2% | -2.1% | 43.1% | 19.6% | 31.9% | 4.5% |
| Commercial | 1.8% | 23.3% | 9.2% | 4.5% | 8.6% | 6.8% |
| Transport | 1.6% | 21.6% | 24.2% | 11.5% | -0.7% | 0.8% |
| Communication | 6.8% | 119.4% | 96.9% | 40.3% | 16.8% | 1.6% |
| Power | 6.2% | 105.8% | -36.4% | -20.3% | 6.5% | 2.7% |
| MFG | 5.0% | 78.7% | 6.1% | 3.0% | 23.1% | 3.5% |
| Other | 0.6% | 7.9% | 9.5% | 4.6% | 9.8% | 5.8% |
| Public | 0.4% | 5.4% | 26.0% | 12.3% | 10.4% | 24.5% |
| Highway | 0.5% | 5.8% | 7.4% | 3.6% | 10.9% | 6.8% |
| Sewer | -0.2% | -3.0% | 36.9% | 17.0% | 8.9% | 1.8% |
| Water | -0.1% | -1.4% | -3.9% | -2.0% | 6.9% | 1.1% |
| Other | 0.5% | 6.7% | 37.3% | 17.2% | 10.6% | 14.8% |
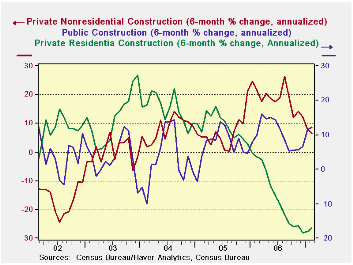 The chart on the left shows trends in the three main construction segments Private residential, Public and other private. These six month annualized growth rates show that nonresidential private spending is faltering, but still carrying positive growth. Private residential spending is stabilizing but still sinking at a steady 19% annualized rate of decline. Public spending is oscillating and growing at about a 12% pace.
We've been talking about the improving economic conditions in Europe, and today the EC reported still more evidence. On a day when US consumer sentiment was reported to be down again, that in Europe improved, and the overall "sentiment indicator", which includes separate readings for various business sectors, gained 1.5 points to 111.2, the highest reading since January 2001. This index is based on a long-term average set at 100, so this reading is 11.2% "higher than average".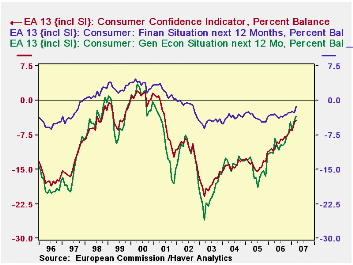
All the sectors contributed to the increase, although construction barely moved, going to 0.2 from 0.0 (these are "percent balance" measures, the percent of respondents with better conditions less that with worsening conditions). More distinctive changes came in industry, which increased from +5.4 in February to +6.1 in March. This reading ties with last November as the highest in the history of the survey, which runs back to 1985. Service businesses' confidence increased to 22.3 for March from 19.6 in February. Sentiment here has run much stronger than in other areas, with readings up in the 30's during the pre-2000 tech boom, so high as 22.3 sounds, it is not relatively as strong as other sectors. Retail trade moved to 0.0 from -1.1, but it had been above zero during much of 2006.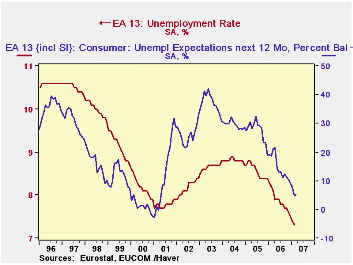
Consumer confidence remains negative at -4.4, but this is still the best level since the spring of 2001. People see the general economic situation as improving, unemployment declining and their own financial prospects also getting better. The only component of consumer confidence not moving favorably is planned savings, which dipped 0.2 to -7.8.
The unemployment situation as perceived by consumers runs close to the actual unemployment experience. That figure was reported today as well, for February. The harmonized rate for the Euro-zone EA13 edged down from 7.4% to 7.3%, the lowest in the 11-year history of these data. In fact, last November, the rate reached 7.6%, the first time it had been below 7.7%. And it's still improving.
| EA13 Business & Consumer Sentiment, SA | Mar 2007 | Feb 2007 | Jan 2007 | Year Ago | 2006 | 2005 | 2004 |
| Economic Sentiment Indicator (LT Avg = 100) | 111.2 | 109.7 | 109.2 | 103.5 | 106.9 | 97.9 | 99.2 |
| Industry (% Balance) | 6.1* | 5.4 | 5.4 | -0.7 | 2.3 | -7.3 | -4.7 |
| Services (% Balance) | 22.3 | 19.6 | 19.6 | 14.5 | 18.1 | 11.1 | 10.6 |
| Consumers (% Balance) | -4.4 | -4.8 | -6.5 | -11.0 | -9.0 | -13.8 | -13.9 |
| Unemployment Rate (%) | -- | 7.3* | 7.4 | 8.2 | 7.9 | 8.6 | 8.8 |
| Consumer Spending And Income Trends | Start of Q4 | |||||
|---|---|---|---|---|---|---|
| Percentage changes at annualized rates: various horizons | ||||||
| Inflation-adjusted | One month | Three months | Six months | One Year | Q1/Q4 | Oct/Q3 |
| Consumption | 2.1% | 3.6% | 4.2% | 3.2% | 3.9% | 3.2% |
| Goods | -3.7% | 3.7% | 5.2% | 3.4% | 5.1% | 1.4% |
| Durable Goods | -1.2% | 6.9% | 7.5% | 5.3% | 9.2% | 5.3% |
| Nondurable Goods | -5.0% | 2.0% | 4.0% | 2.5% | 3.1% | -0.5% |
| Services | 6.2% | 3.8% | 3.6% | 3.2% | 3.3% | 4.7% |
| Consumer Income | ||||||
| Real DPI | 1.7% | 3.4% | 4.9% | 2.6% | 4.0% | |
| Per Capita | 1.0% | 2.6% | 3.9% | 1.6% | ||
| Memo: | Feb.07 | Three-Mos | Six-Mos | One-Year | ||
| Savings Rate (Pct) | -1.2 | -1.3 | -1.2 | -1.2 | ||
| Construction Put In Place $-Millions | ||||||
|---|---|---|---|---|---|---|
| Percentage Change as Noted | ||||||
| 1-Mo | 1-Mo SAAR | 3-Mo | 6-MO | Yr/Yr | Share | |
| Total | 0.3% | 3.3% | -9.4% | -4.8% | -2.4% | 100.0% |
| Private | 0.2% | 2.6% | -18.1% | -9.5% | -6.0% | 75.5% |
| Residential | -1.0% | -11.0% | -31.2% | -17.0% | -15.1% | 48.0% |
| Lodging | 2.6% | 35.8% | 46.2% | 20.9% | 45.4% | 1.9% |
| Office | -0.2% | -2.1% | 43.1% | 19.6% | 31.9% | 4.5% |
| Commercial | 1.8% | 23.3% | 9.2% | 4.5% | 8.6% | 6.8% |
| Transport | 1.6% | 21.6% | 24.2% | 11.5% | -0.7% | 0.8% |
| Communication | 6.8% | 119.4% | 96.9% | 40.3% | 16.8% | 1.6% |
| Power | 6.2% | 105.8% | -36.4% | -20.3% | 6.5% | 2.7% |
| MFG | 5.0% | 78.7% | 6.1% | 3.0% | 23.1% | 3.5% |
| Other | 0.6% | 7.9% | 9.5% | 4.6% | 9.8% | 5.8% |
| Public | 0.4% | 5.4% | 26.0% | 12.3% | 10.4% | 24.5% |
| Highway | 0.5% | 5.8% | 7.4% | 3.6% | 10.9% | 6.8% |
| Sewer | -0.2% | -3.0% | 36.9% | 17.0% | 8.9% | 1.8% |
| Water | -0.1% | -1.4% | -3.9% | -2.0% | 6.9% | 1.1% |
| Other | 0.5% | 6.7% | 37.3% | 17.2% | 10.6% | 14.8% |
| EA13 Business & Consumer Sentiment, SA | Mar 2007 | Feb 2007 | Jan 2007 | Year Ago | 2006 | 2005 | 2004 |
|---|---|---|---|---|---|---|---|
| Economic Sentiment Indicator (LT Avg = 100) |
111.2 | 109.7 | 109.2 | 103.5 | 106.9 | 97.9 | 99.2 |
| Industry (% Balance) | 6.1* | 5.4 | 5.4 | -0.7 | 2.3 | -7.3 | -4.7 |
| Services (% Balance) | 22.3 | 19.6 | 19.6 | 14.5 | 18.1 | 11.1 | 10.6 |
| Consumers (% Balance) | -4.4 | -4.8 | -6.5 | -11.0 | -9.0 | -13.8 | -13.9 |
| Unemployment Rate (%) | -- | 7.3* | 7.4 | 8.2 | 7.9 | 8.6 | 8.8 |

Robert Brusca
AuthorMore in Author Profile »Robert A. Brusca is Chief Economist of Fact and Opinion Economics, a consulting firm he founded in Manhattan. He has been an economist on Wall Street for over 25 years. He has visited central banking and large institutional clients in over 30 countries in his career as an economist. Mr. Brusca was a Divisional Research Chief at the Federal Reserve Bank of NY (Chief of the International Financial markets Division), a Fed Watcher at Irving Trust and Chief Economist at Nikko Securities International. He is widely quoted and appears in various media. Mr. Brusca holds an MA and Ph.D. in economics from Michigan State University and a BA in Economics from the University of Michigan. His research pursues his strong interests in non aligned policy economics as well as international economics. FAO Economics’ research targets investors to assist them in making better investment decisions in stocks, bonds and in a variety of international assets. The company does not manage money and has no conflicts in giving economic advice.
More Economy in Brief


