U.S. Initial Claims for Unemployment Insurance Rise in Latest Week
by:Tom Moeller
|in:Economy in Brief
Summary
- Initial claims increase to highest in four weeks.
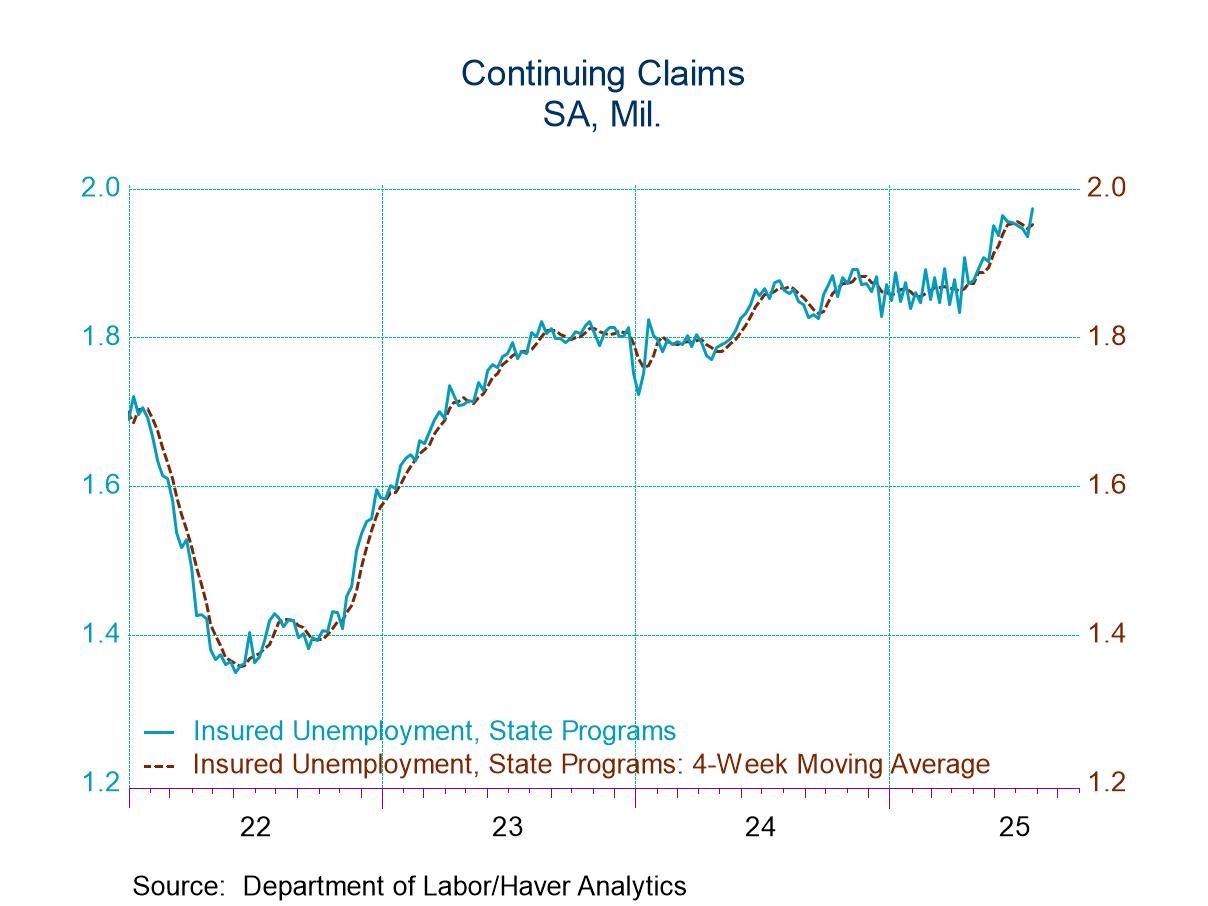
- Continuing claims continue upward trend.
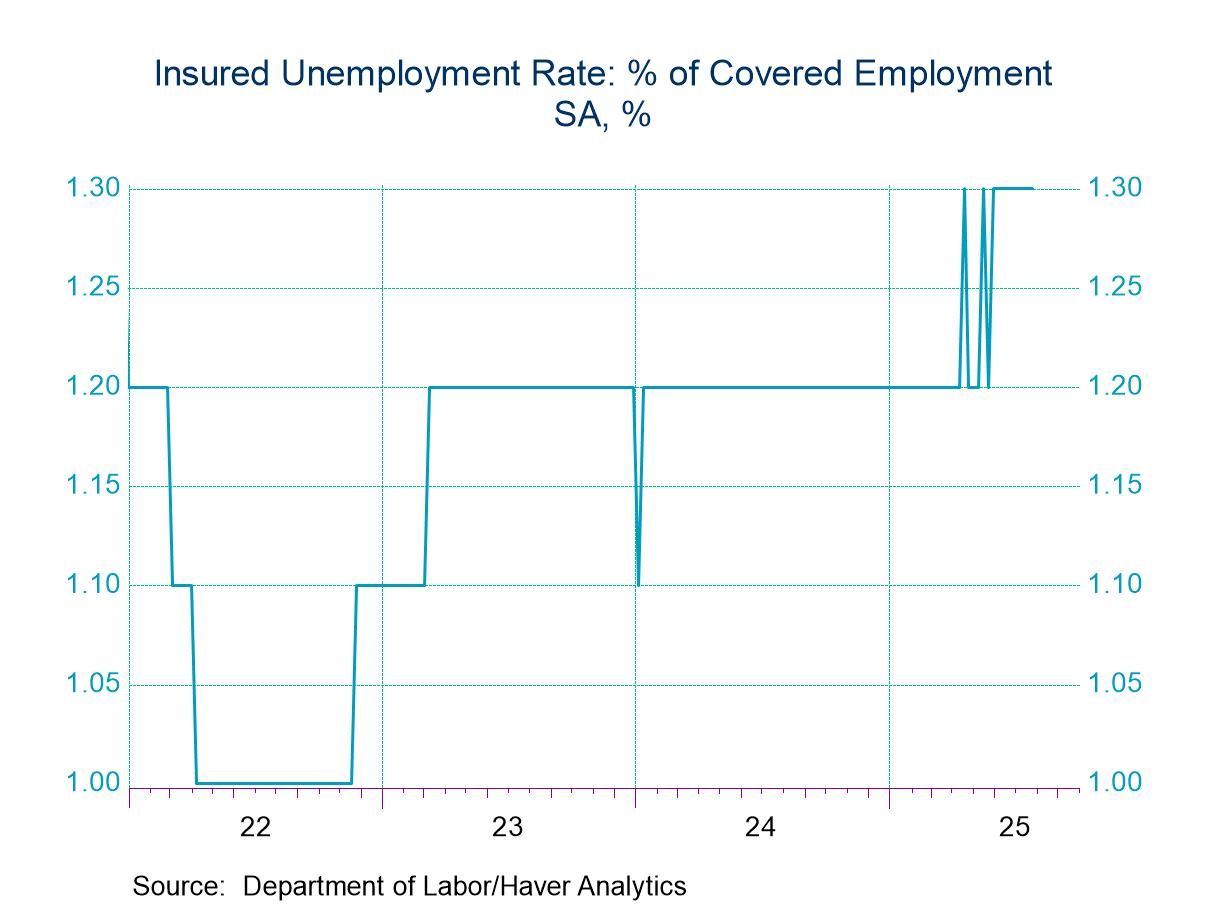
- Insured unemployment rate holds steady.
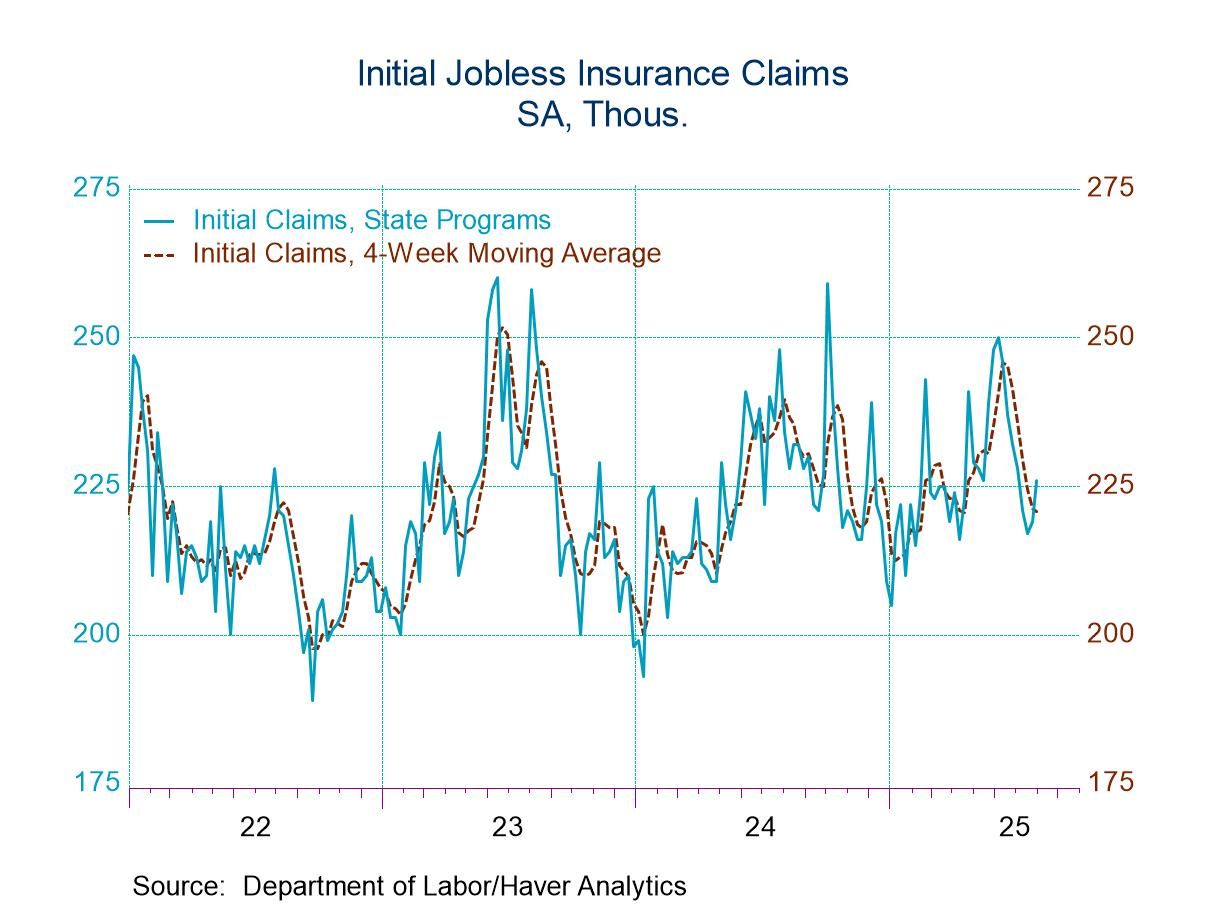
Initial claims for unemployment insurance rose to 226,000 (-3.4% y/y) during the week ended August 2 after increasing to 219,000 in the prior week, revised from 218,000. The Action Economics Forecast Survey expected 222,000 initial claims for last week. The four-week moving average of initial claims edged lower to 220,750 from 221,250. It was the lowest level since the third week of April.
In the week ended July 26, the total number of unemployment insurance beneficiaries – also known as “continuing claims” – was 1.974 million (+5.2% y/y), up from 1.936 million in the prior week, revised from 1.946 million. The four-week moving average rose to 1.952 million, and was increased from 1.862 million in the second week of April.
In the week ending July 26, the insured rate of unemployment (the number of beneficiaries as a percent of covered employment) was 1.3% for the ninth straight week. It had increased from 1.2% since the beginning of 2023 and 1.0% in November 2022.
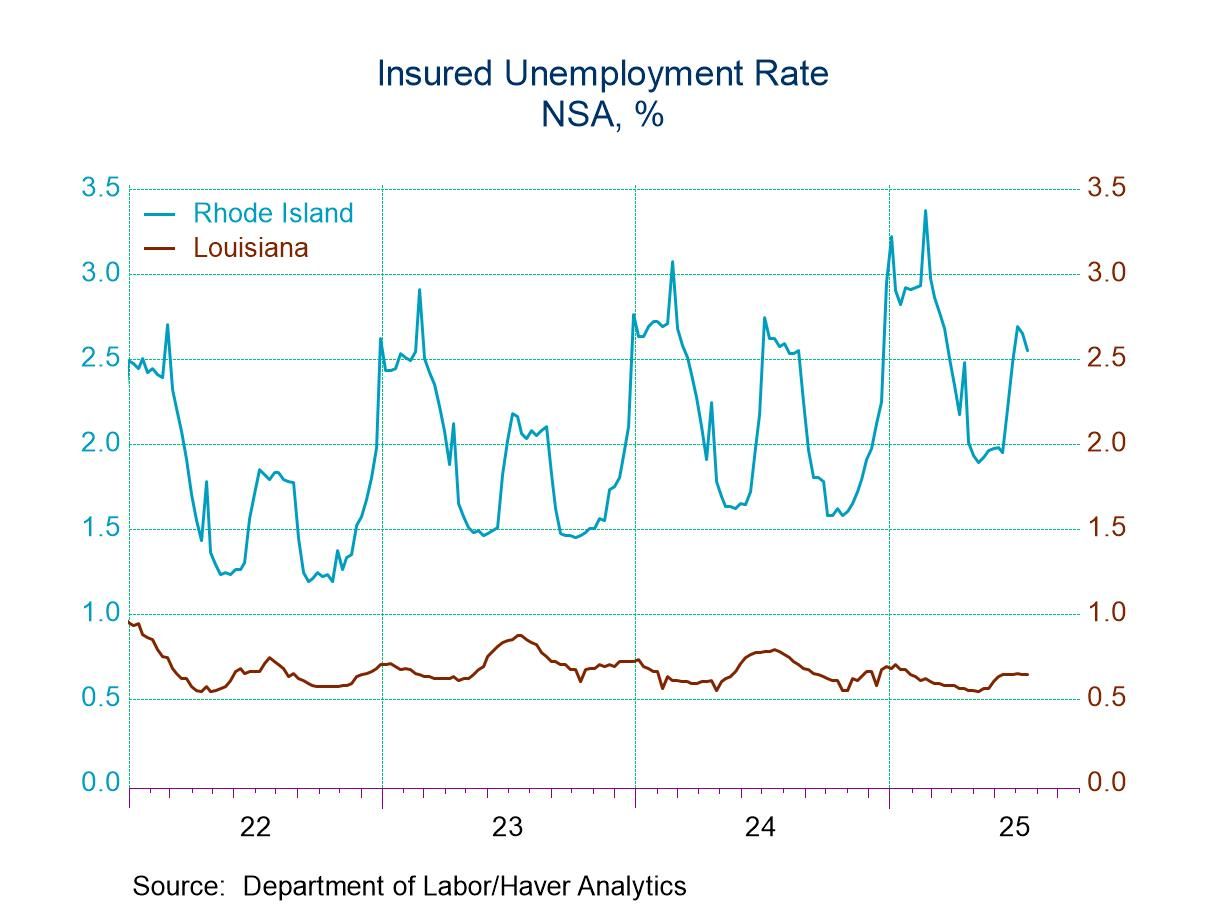
The insured unemployment rate varied greatly across individual states and territories. In the week ended July 19, the highest unemployment rates were in New Jersey (2.76%), Puerto Rico (2.67%), Rhode Island (2.55%), California (2.20%), Minnesota (2.18%), Massachusetts (2.12%), and District of Colombia and Washington (both 2.08%). The lowest were in South Dakota (0.30%), Florida (0.41%), North Carolina (0.48%) Georgia (0.61%) and Louisiana (0.64%). Rates in other notable states include Pennsylvania (1.90%), Illinois (1.77%), New York (1.74%), Texas (1.31%) and Michigan (1.24%). These state data are not seasonally adjusted.
Data on weekly unemployment claims are from the Department of Labor itself, not the Bureau of Labor Statistics. They begin in 1967 and are contained in Haver’s WEEKLY database and summarized monthly in USECON. Data for individual states are in REGIONW back to December 1986. The expectations figure is from the Action Economics Forecast Survey in the AS1REPNA database.

Tom Moeller
AuthorMore in Author Profile »Prior to joining Haver Analytics in 2000, Mr. Moeller worked as the Economist at Chancellor Capital Management from 1985 to 1999. There, he developed comprehensive economic forecasts and interpreted economic data for equity and fixed income portfolio managers. Also at Chancellor, Mr. Moeller worked as an equity analyst and was responsible for researching and rating companies in the economically sensitive automobile and housing industries for investment in Chancellor’s equity portfolio. Prior to joining Chancellor, Mr. Moeller was an Economist at Citibank from 1979 to 1984. He also analyzed pricing behavior in the metals industry for the Council on Wage and Price Stability in Washington, D.C. In 1999, Mr. Moeller received the award for most accurate forecast from the Forecasters' Club of New York. From 1990 to 1992 he was President of the New York Association for Business Economists. Mr. Moeller earned an M.B.A. in Finance from Fordham University, where he graduated in 1987. He holds a Bachelor of Arts in Economics from George Washington University.
More Economy in Brief


 Global