U.S. Employment Unexpectedly Fell in February
by:Sandy Batten
|in:Economy in Brief
Summary
- Nonfarm payrolls fell 92,000 in February with downward revisions to both December and January
- Private sector payrolls fell 86,000 in February.
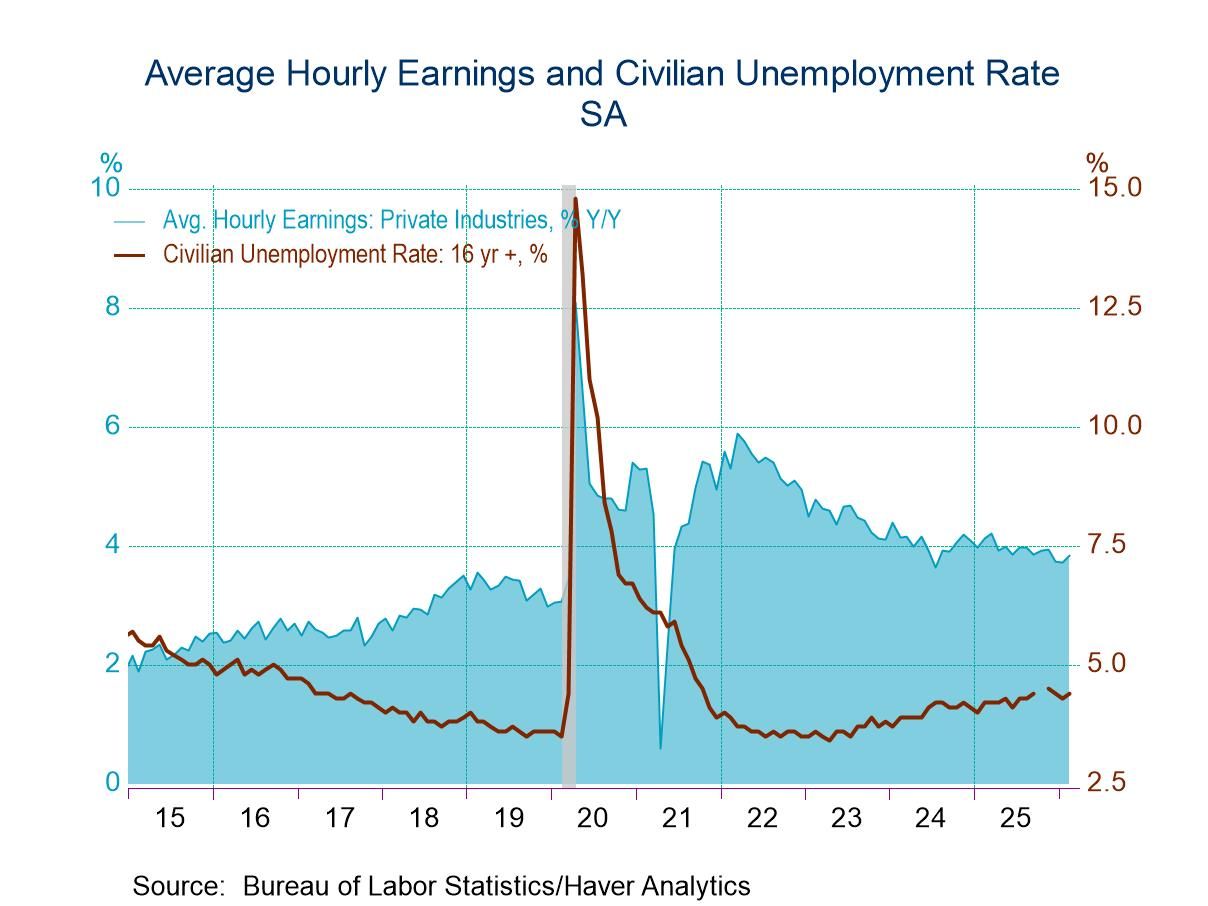
- Average hourly earnings annual growth increased to 3.8% from 3.7% in both December and January.
- Unemployment in the household survey increased 203,000, pushing the unemployment rate up to 4.4% from 4.3% in January.
- The delayed population adjustment to the household data was a very large negative as had been expected given the observed declines in immigration.
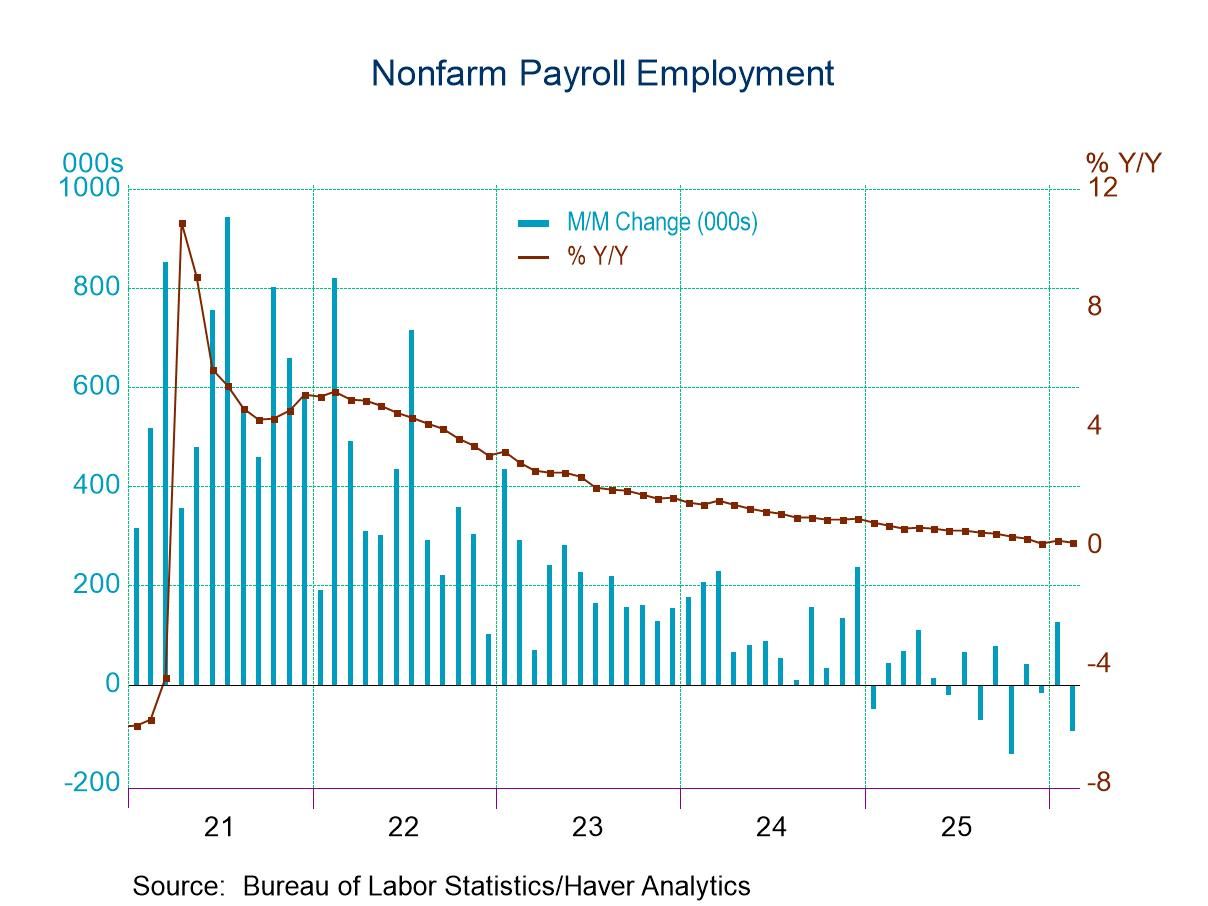
Nonfarm payroll employment (from the survey of establishments) unexpectedly fell by 92,000 in February with downward revisions to December and January, according to today’s report from the Bureau of Labor Statistics. The Action Economics Survey expected payrolls to increase by 63,000. The 130,000 monthly increase previously reported for January was revised down to 126,000 while the 48,000 gain previously reported for December was revised down to a 17,000 decline. Over the past three months, nonfarm payrolls have averaged a 6,000 monthly increase. Over the past six months, payrolls have averaged a 1,000 monthly decline. So, clearly labor market conditions have softened.
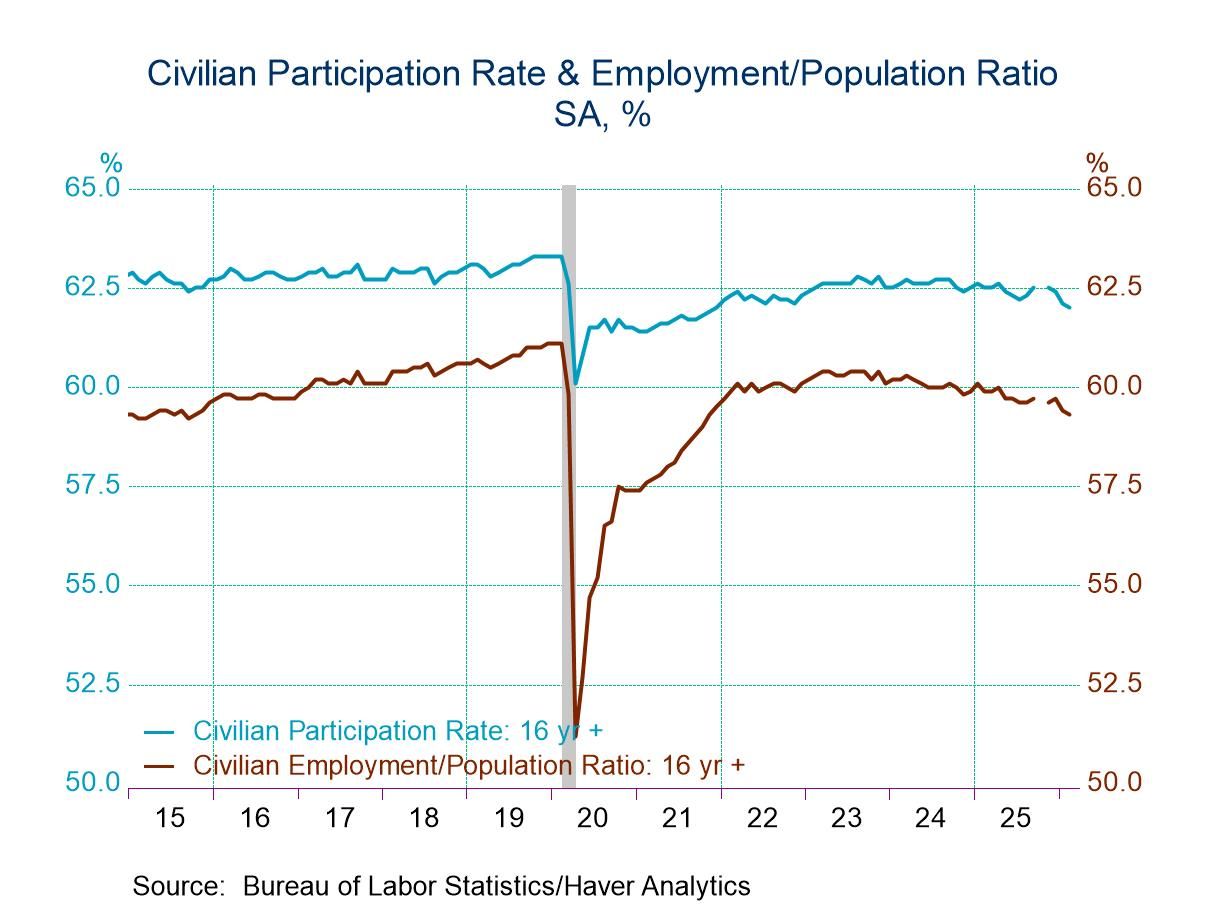
The meaningfully weaker payroll report was reinforced by a 203,000 increase in the number unemployed from the household survey, which led to a 0.1%-point increase in the unemployment rate. The labor force participation rate continued its downtrend by falling to 62.0% in February, the lowest reading December 2021, from 62.1% in January. Household employment fell by 185,000, its first monthly decline since July. Unseasonably cold weather did not appear to be a meaningful factor behind the drop in employment. The survey reported that 228,000 employed workers could not get to work because of the weather. This not seasonally adjusted figure was not unusually high for this time of the year and in fact was about half the size of the figures reported last January and February.
Today’s report contained the annual population adjustments for the household survey figures. These adjustments are usually released with the January figures that are released in February. However, the shutdown of the federal government in October and early November last year delayed that release. As widely expected, the population adjustment this year was extremely large and negative (-1.4 million for the labor force), reflecting the marked decrease in immigration that has occurred over the past year with the changes in immigration policy. Note that this adjustment is only made on 2026 household data. So, any comparison of current household data with that in previous years would be an apples-to-oranges comparison. However, Haver Analytics calculates population-adjusted household data for the major aggregates. They are in the USECON database.
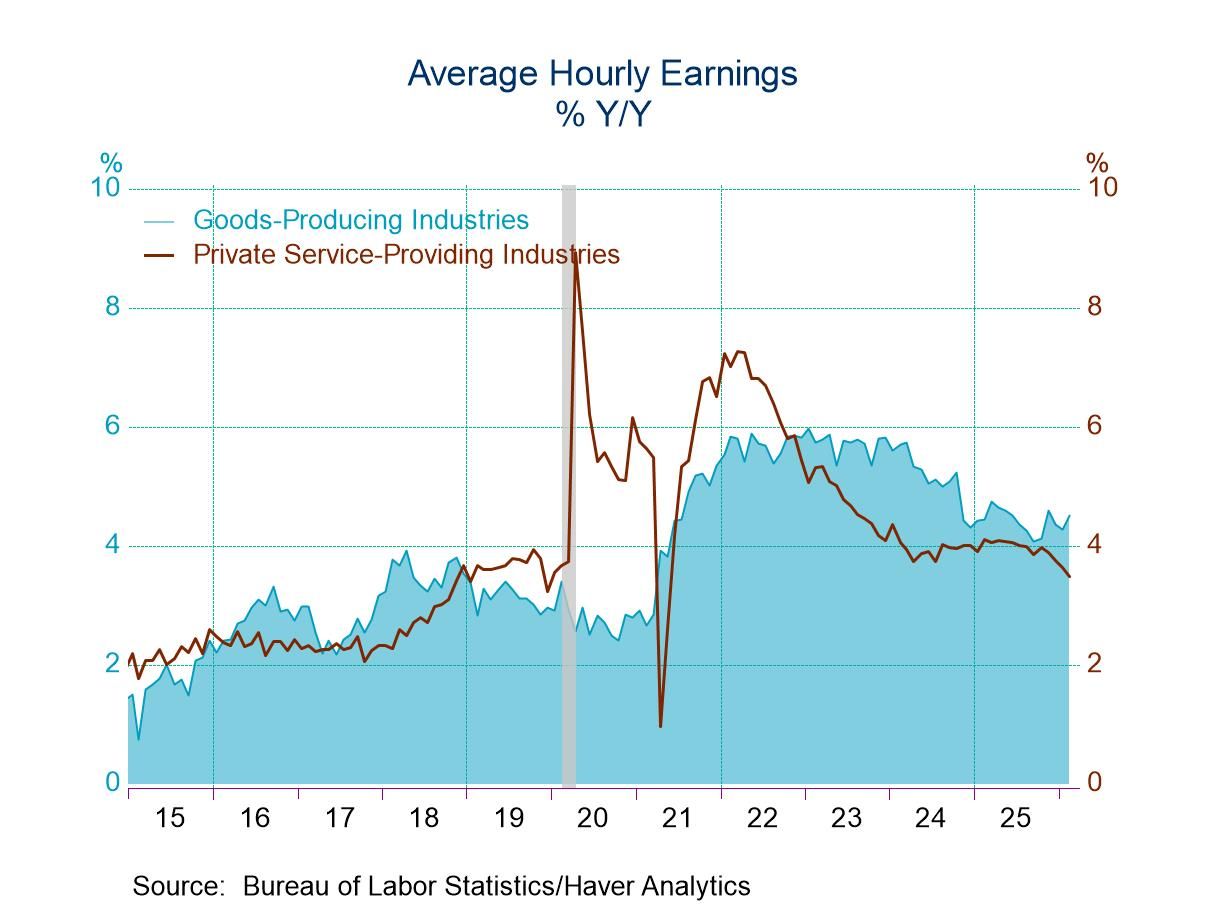
Growth of average hourly earnings (AHE), a key variable for the Federal Reserve, picked up slightly in February. AHE increased 0.4% m/m, slightly above the expected 0.3% monthly gain. The y/y rate of advance edged up to 3.8% in February from 3.7% in January. Wage growth in private service-producing firms was unchanged at 3.7% y/y while goods-producing wage growth rose to 4.2% y/y, the highest rate since May, from 4.0% y/y in January. The current pace of total AHE growth is likely to be still a little too fast to be consistent with the Fed’s 2% inflation target, although continued solid productivity growth could restrain some of the inflationary impact of the current pace of wage growth.
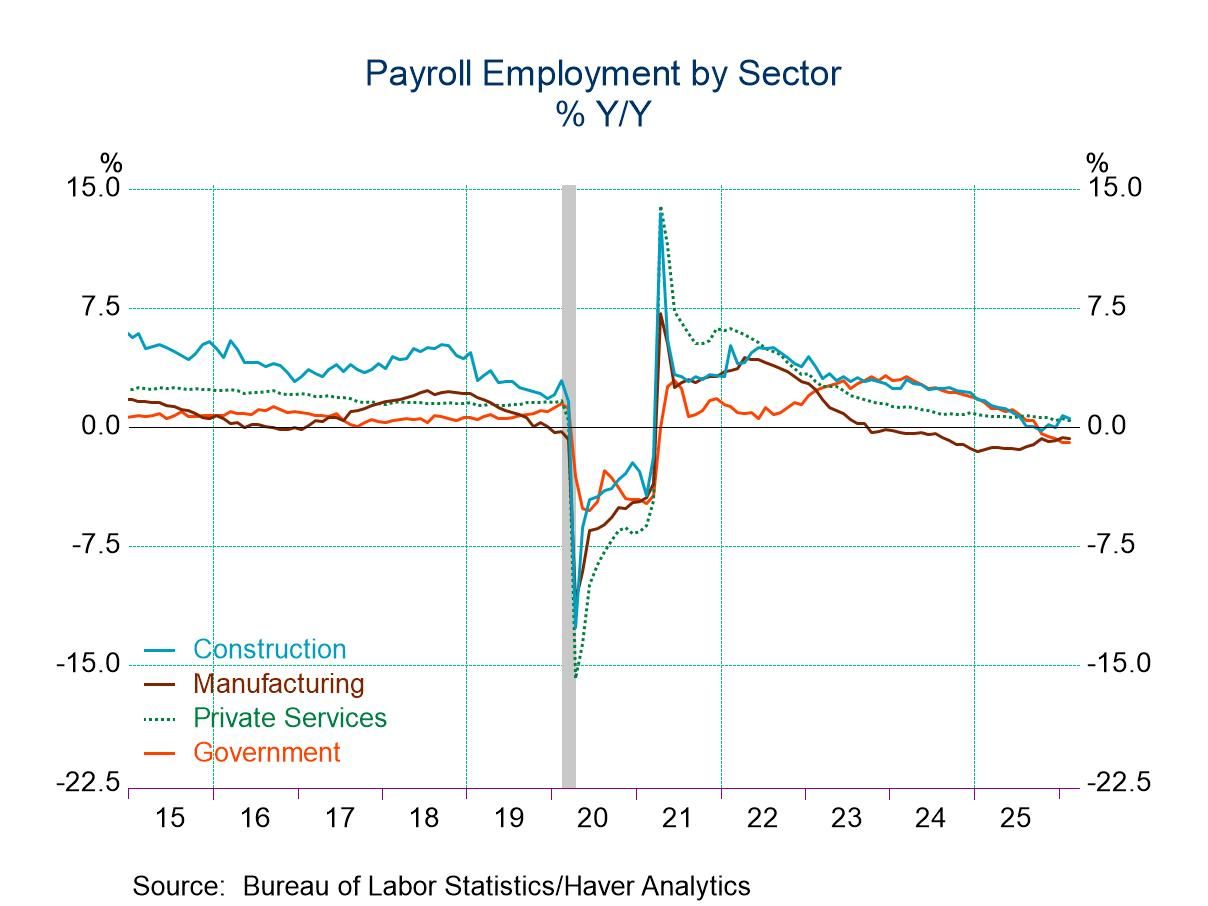
In the establishment survey, private-sector employment fell 86,000 in February, the weakest reading since December 2020. The Action Economics Forecast Survey looked for an 85,000 increase. Moreover, figures for both December and January were revised lower. The 172,000 increase previously reported for January was revised to 146,000 while the 64,000 rise previously reported for December was revised to a 7,000 decrease. Government employment fell 6,000, the fifth consecutive monthly decline.
Goods-producing employment declined 25,000 in February following a 51,000 jump in January. Construction employment slumped 11,000, likely adversely affected by the unseasonably cold weather, after a surprising 48,000 jump in January. Manufacturing jobs fell 12,000 in February following a 5,000 gain in January. Manufacturing employment fell in each month in 2025, not the result that the Trump Administration new tariff policy had intended. Private service-producing employment fell 61,000, its first monthly decline since last June. Healthcare and social assistance employment, which had previously been a major support for overall employment, fell 18,600 in February, its first monthly decline since January 2022. However, part of the February decrease reflected 31,000 striking nurses in California during the survey period. Monthly declines were widespread across the service-producing sector while any gain was extremely small. Leisure and hospitality employment fell 27,000 in February on top of a 12,000 decline in the previous month.
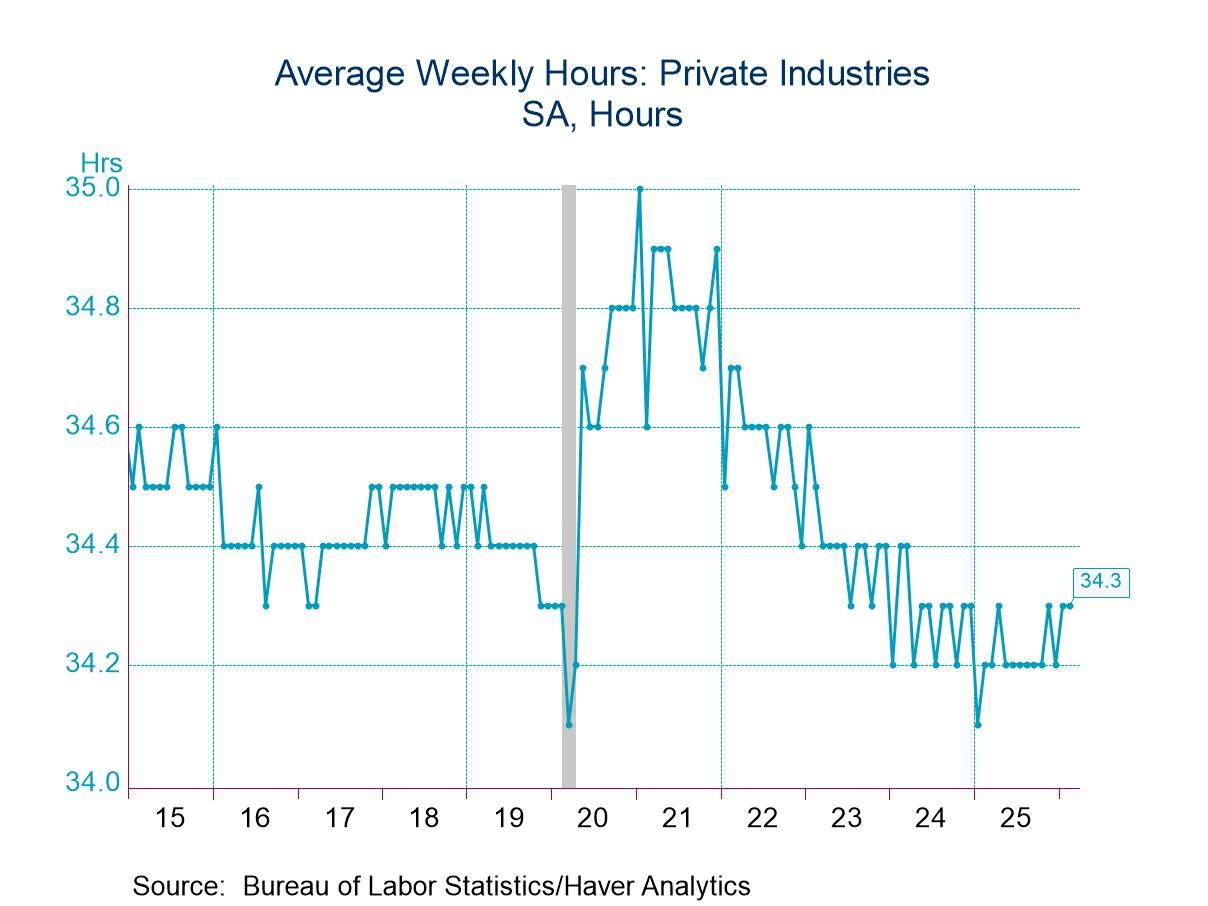
The length of the workweek was unchanged at 34.3 hours in February. Also, aggregate weekly hours were unchanged in February. The goods-producing workweek edged up to 40.1 hours, the highest since January 2023, while the private service-producing workweek was unchanged at 33.2 hours in February.
The employment and earnings data are collected from surveys taken each month during the week containing the 12th day of the month. The labor market data are contained in Haver's USECON database. Detailed figures are in the EMPL and LABOR databases. The expectations figures are in the AS1REPNA database.

Sandy Batten
AuthorMore in Author Profile »Sandy Batten has more than 30 years of experience analyzing industrial economies and financial markets and a wide range of experience across the financial services sector, government, and academia. Before joining Haver Analytics, Sandy was a Vice President and Senior Economist at Citibank; Senior Credit Market Analyst at CDC Investment Management, Managing Director at Bear Stearns, and Executive Director at JPMorgan. In 2008, Sandy was named the most accurate US forecaster by the National Association for Business Economics. He is a member of the New York Forecasters Club, NABE, and the American Economic Association. Prior to his time in the financial services sector, Sandy was a Research Officer at the Federal Reserve Bank of St. Louis, Senior Staff Economist on the President’s Council of Economic Advisors, Deputy Assistant Secretary for Economic Policy at the US Treasury, and Economist at the International Monetary Fund. Sandy has taught economics at St. Louis University, Denison University, and Muskingun College. He has published numerous peer-reviewed articles in a wide range of academic publications. He has a B.A. in economics from the University of Richmond and a M.A. and Ph.D. in economics from The Ohio State University.
More Economy in Brief


 Global