 Asia| Apr 20 2026
Economic Letter from Asia: Barrel of Doubt
In this week’s Letter, we take stock of the latest economic data from China, assessing what it tells us about the outlook for growth and policy. We also continue our coverage of the Middle East conflict, focusing on its broader implications for Asia through energy markets, trade routes, and regional risk sentiment.On China, while Q1 GDP data exceeded expectations, putting the economy on a firm footing to meet its annual growth target (chart 1), a closer look at the underlying monthly indicators suggests the headline resilience may be masking a more uneven underlying picture (chart 2).
As for the Middle East, the latest round of regional March CPI prints largely confirms the initial pass-through from higher oil prices to consumer inflation. If energy prices remain elevated, second-round effects will likely become more evident in the coming months (chart 3). Turning to the Strait of Hormuz, shipping data point to a gradual recovery in flows. However, conflicting signals on the strait’s status—alongside renewed US–Iran tensions—continue to cloud the outlook for a sustained normalization in global oil supply (chart 4). In response, global players have begun to adapt, including rerouting shipments via the longer but safer Cape of Good Hope route, and exploring alternative export channels through Red Sea ports, even though these remain exposed to regional risks (chart 5). Finally, the conflict has prompted a reassessment of the global outlook. In its latest World Economic Outlook, the IMF delivered broad-based growth downgrades across economies, with only a handful of exceptions (chart 6).
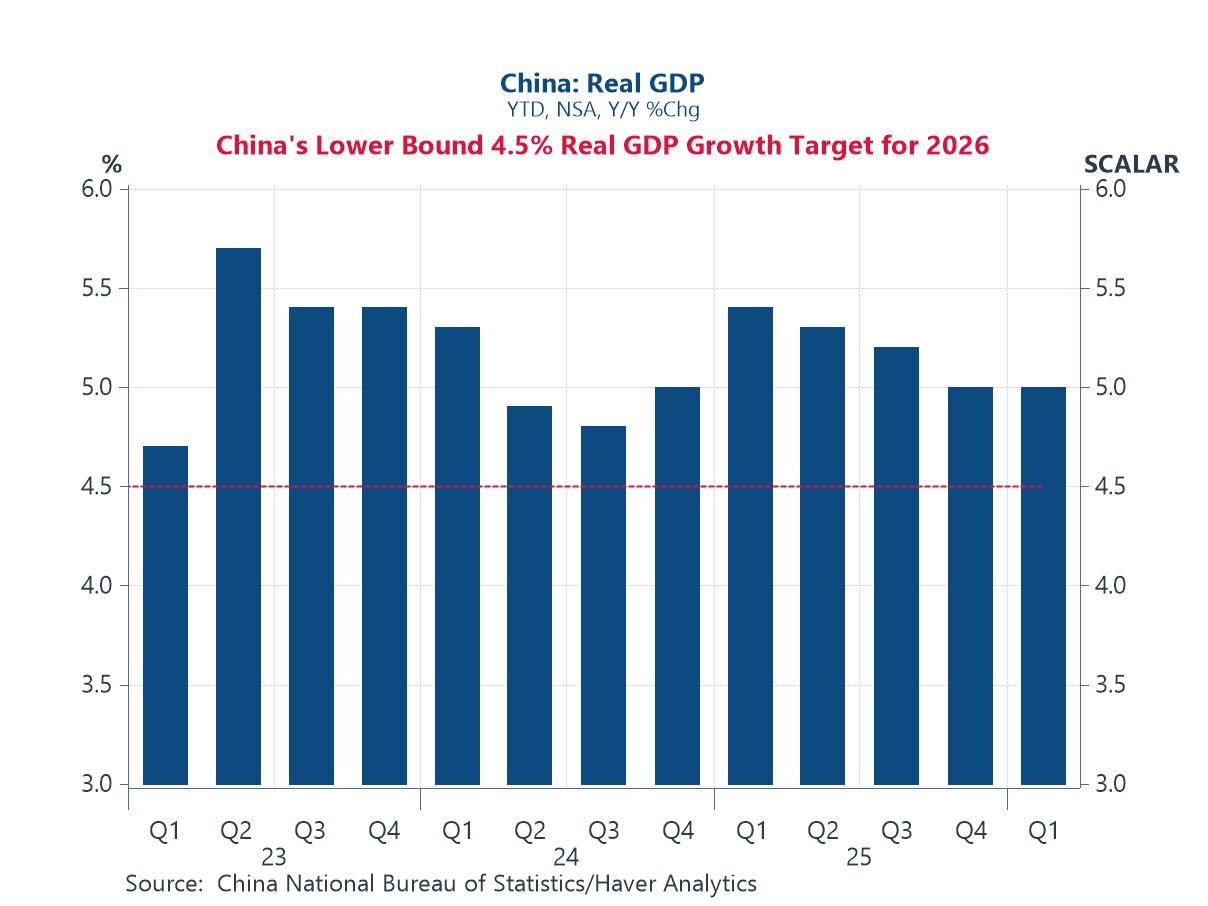
China China released a raft of data late last week, with March figures particularly pertinent as they capture the initial effects of the Middle East conflict that erupted in late February. Notably, Q1 GDP exceeded expectations, with the economy expanding 5% y/y despite incorporating March data (chart 1). This suggests China has secured a firm early footing toward its 4.5%–5% growth target for the year—a slight step down from last year’s “about 5%” goal. But a closer look at the March data reveals several nuances. On the external front, export growth slowed sharply year-to-date, falling behind import growth, thereby dragging on trade balance growth.
Chart 1: China’s year-to-date real GDP growth
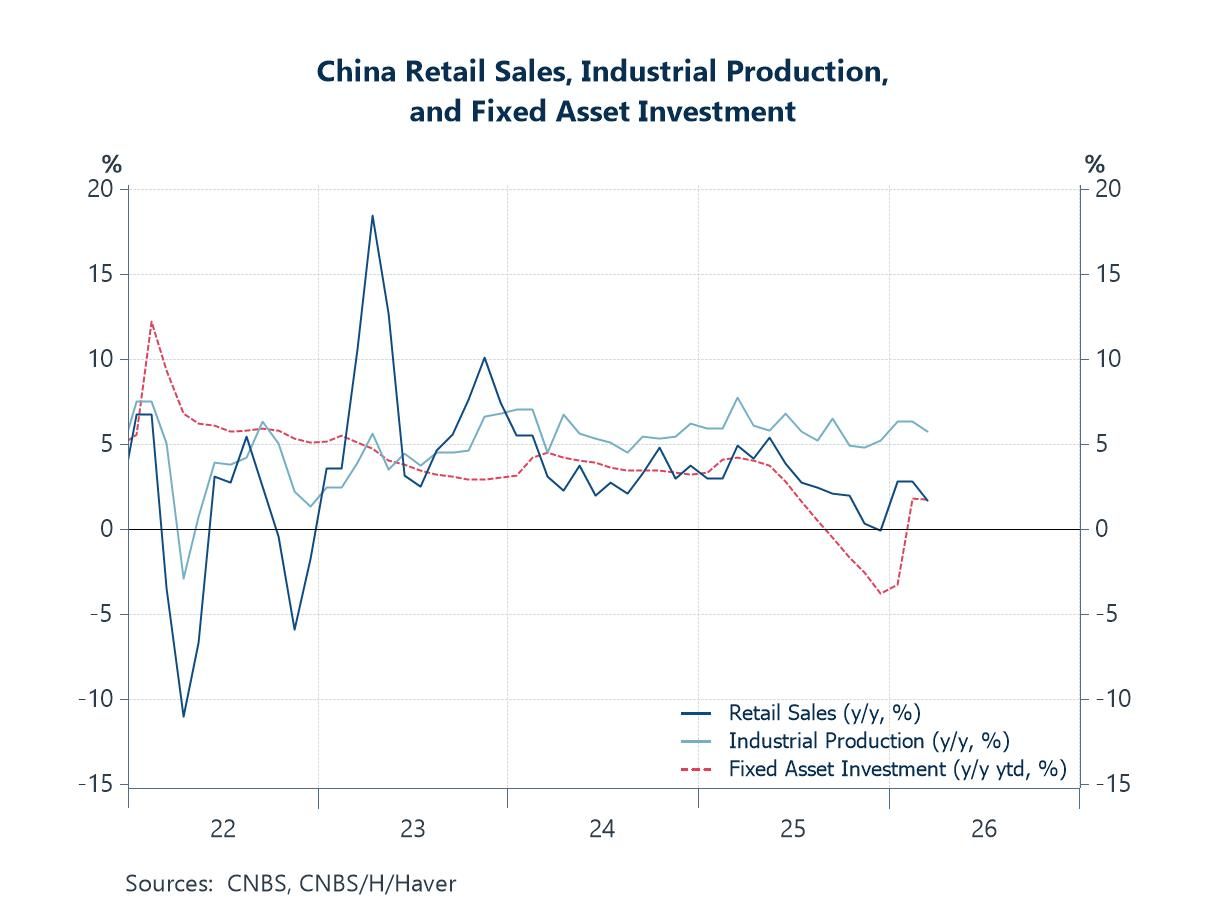
On a more downbeat note, growth in retail sales, industrial production, and fixed asset investment all moderated in March (chart 2). While this may partly reflect spillovers from the Middle East conflict, it likely also points to underlying domestic factors, including the fading impact of earlier, possibly one-off, policy support measures. That said, not all signals point to deterioration. Industrial profits have shown signs of improvement, likely supported in part by authorities’ efforts to curb intense price competition, also termed as “involution”, amid excess supply. This has contributed to a gradual easing in producer price deflation, which is beginning to feed through to a modest improvement in consumer inflation.
Chart 2: China retail sales, industrial production, and fixed asset investment
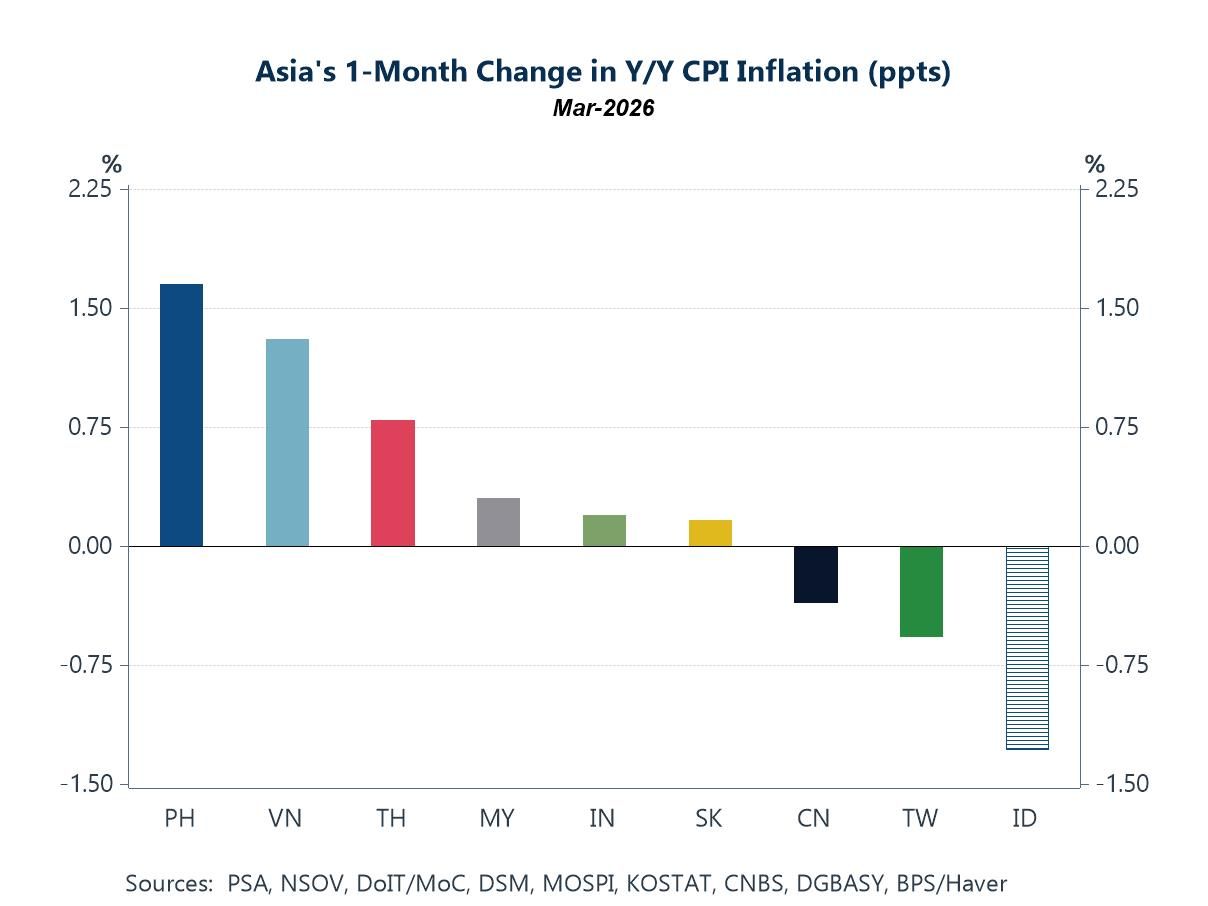
The Middle East conflict – Impacts Among economies that have reported March CPI so far, chart 3 shows that Asian inflation prints have more often than not come in higher y/y than in February. While specific domestic factors are also at play, the uptick has largely coincided with a rebound in energy-related inflation, in line with the global price surge following the Middle East supply shock. Given the pervasive role of energy as a key input across economic activity—from manufacturing to trade—what we are observing thus far likely reflects primarily first-round effects. Should energy prices remain elevated, second-round effects are likely to emerge in subsequent inflation prints.
Chart 3: Asia’s 1-month change in y/y CPI inflation
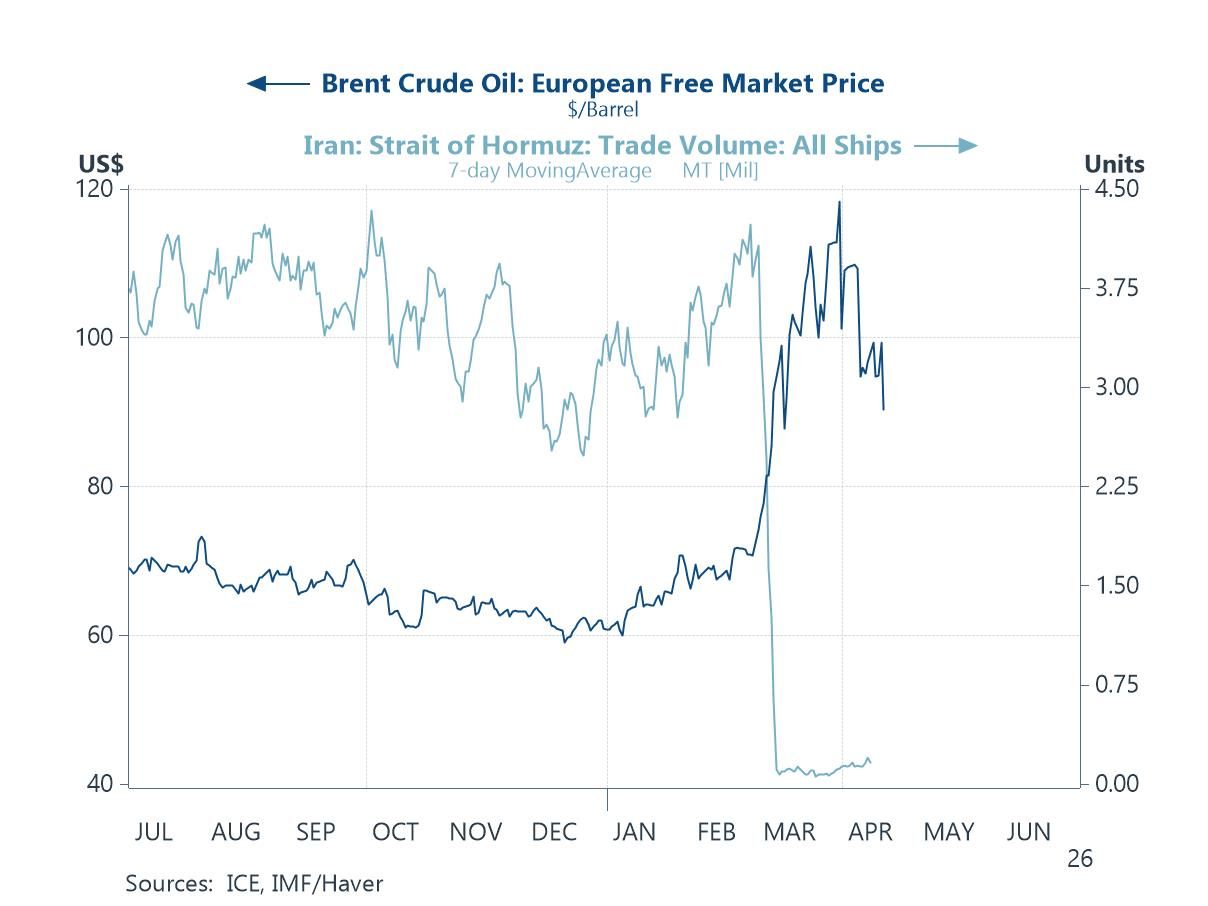
Whether energy prices remain elevated in the near term ultimately hinges on the same factor that drove the initial surge: oil flows through the critical Strait of Hormuz. On that front, IMF data suggest shipping volumes have continued to edge higher, though recent headlines have kept crude prices volatile. For instance, earlier assurances by Iranian authorities that the strait was “fully open” triggered a sharp decline in crude oil prices. However, weekend reports of a renewed closure—alongside news that the US had seized an Iranian-flagged vessel—serve as a stark reminder that tensions remain elevated and that disruptions to oil flows may well be set to persist.
Chart 4: Brent crude oil prices and shipping volumes through the Strait of Hormuz
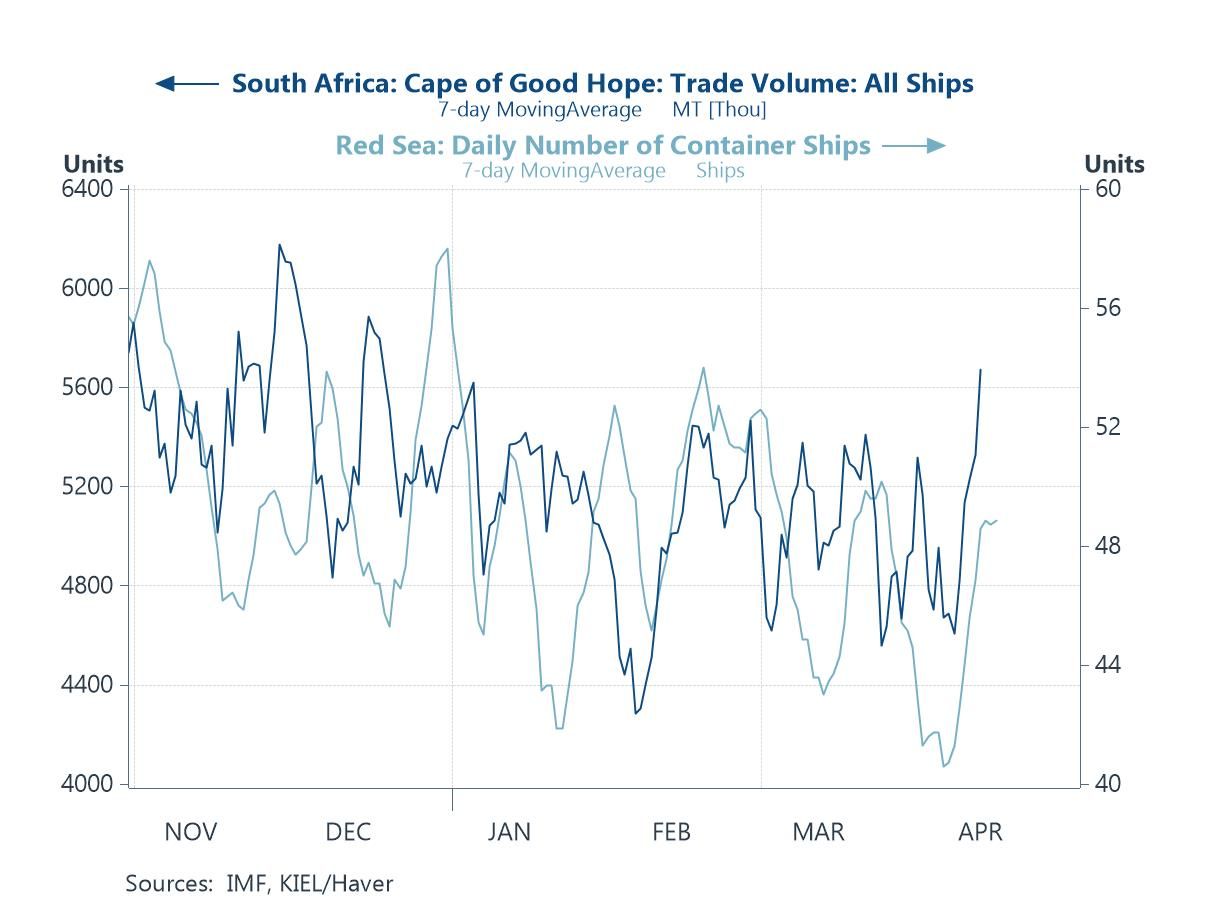
The Middle East conflict – Considerations That said, the global response has not been passive. Economies have increasingly sought alternative energy sources and rerouted oil shipments via other channels. Over a longer horizon, both producers constrained by exports through the Strait of Hormuz and importers heavily reliant on the route are likely developing contingency plans to hedge against the risk of a prolonged disruption at this critical chokepoint. For instance, amid heightened geopolitical tensions in the Middle East, more shipments are being diverted along the longer—but relatively safer—route via the Cape of Good Hope, bypassing the region. At the same time, there has been growing consideration of redirecting exports through Red Sea ports by shifting flows away from Hormuz-linked terminals. However, these alternatives are not without limitations. They remain exposed to regional risks, while capacity constraints—particularly in existing pipeline infrastructure—mean they could not fully offset a disruption to flows through the strait.
Chart 5: Shipping through the Cape of Good Hope and the Red Sea
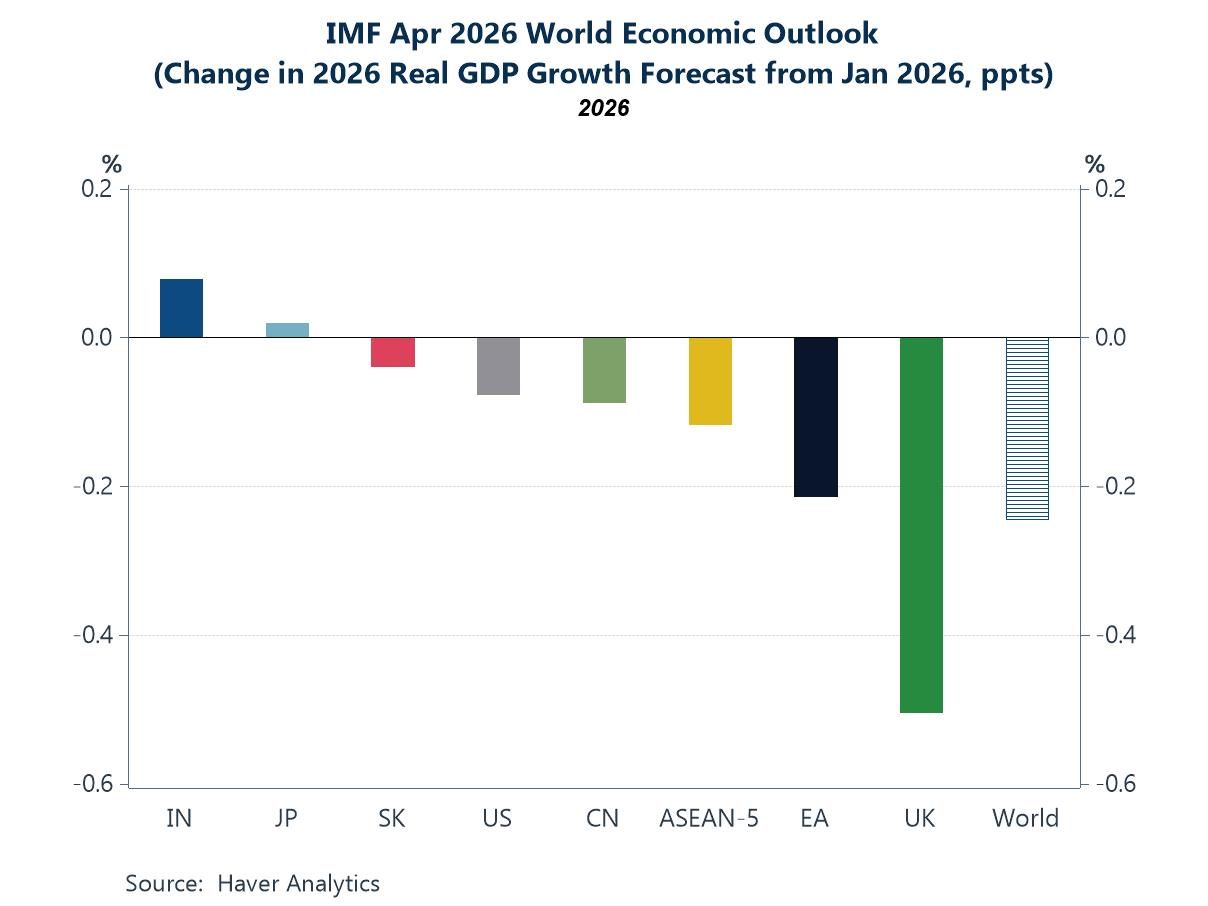
Lastly, we turn to the IMF’s latest World Economic Outlook, released last week. Reflecting the growth-dampening effects of the Middle East crisis, the IMF downgraded its real GDP forecasts for most economies, resulting in a modest downward revision to global growth overall. Across Asian and major non-Asian economies (chart 6), only India and Japan saw upgrades, likely supported by offsetting domestic or structural drivers. European economies registered the steepest downgrades, while China and the US, though also revised lower, appear relatively more insulated. Importantly, these projections assume the conflict remains contained in duration, intensity, and scope, and begins to fade by mid-year. Should it persist or escalate beyond that, further downside risks to growth are likely to materialize.
Chart 6: IMF April 2026 vs. January 2026 change in real GDP growth forecast

Tian Yong Woon
AuthorMore in Author Profile »Tian Yong joined Haver Analytics as an Economist in 2023. Previously, Tian Yong worked as an Economist with Deutsche Bank, covering Emerging Asian economies while also writing on thematic issues within the broader Asia region. Prior to his work with Deutsche Bank, he worked as an Economic Analyst with the International Monetary Fund, where he contributed to Article IV consultations with Singapore and Malaysia, and to the regular surveillance of financial stability issues in the Asia Pacific region.
Tian Yong holds a Master of Science in Quantitative Finance from the Singapore Management University, a Master of Science in Analytics from the Georgia Institute of Technology, a Bachelor of Science in Mathematics from the Singapore University of Social Sciences, and a Bachelor of Science in Banking and Finance from the University of London.
More Economy in Brief


