Industrial Production: Soft in March
Summary
- Downward noise in utility output; slow activity in manufacturing and mining.
- Flat underlying trend in recent months.

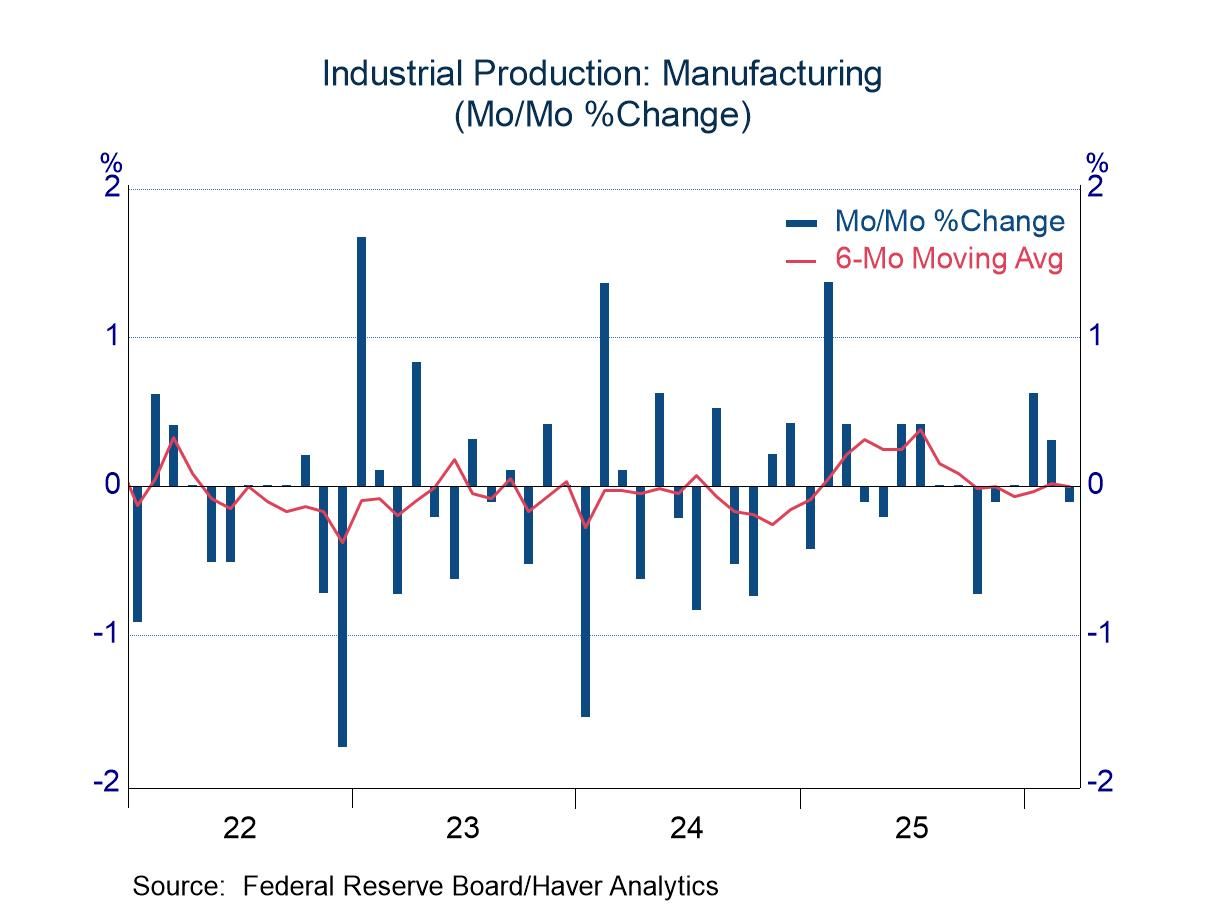
The industrial production index fell 0.5% in March, noticeably weaker than the expected increase of 0.1%. In addition, the March results were joined by slight net downward revisions in prior months (sharp upward revision in February offset by a larger downward adjustment in January and tweaks in earlier months). A good portion of the March softness was the result of a drop of 2.3% in utility output, which is not deeply concerning because changes in this sector typically are driven by weather conditions. However, mining activity also was soft (-1.2%), and manufacturing production dipped 0.1%.
Within manufacturing, auto production played a large role in the dip, registering a decline of 3.7%. However, the auto sector had plenty of company on the soft side, as furniture, textiles, apparel, and printing all posted declines of more than 1.0%. Given these drags, manufacturing output excluding autos rose only 0.1%. There was a nearly even split between expanding and contracting industries within manufacturing: 11 boosting production and 9 reducing activity.
The dip in manufacturing activity in March might seem inconsequential in light of solid advances in January and February (up 0.6% and 0.4%, respectively). However, the gains early in the year followed a weak fourth quarter, leaving an unimpressive trend.
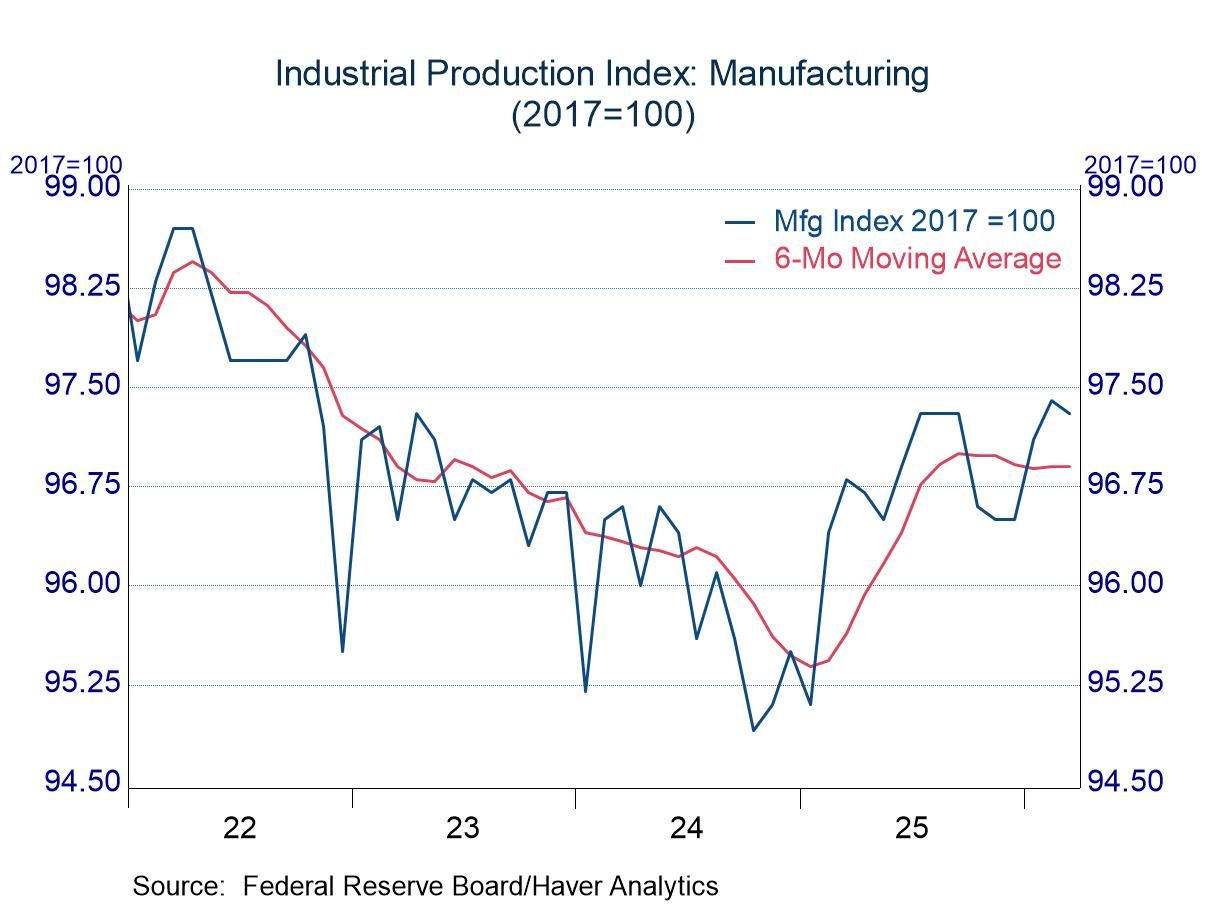
Trends in industrial activity are often more apparent by focusing on the level of production indexes rather than month-to-month (or quarter-to-quarter) changes. As shown the chart below, the level of the manufacturing index stirred for a time in 2025, but it lost momentum in the closing months of the year. Changes so far in 2026 have not pushed the index above the September 2025 peak. The 6-month moving average of the manufacturing index is now running sideways.
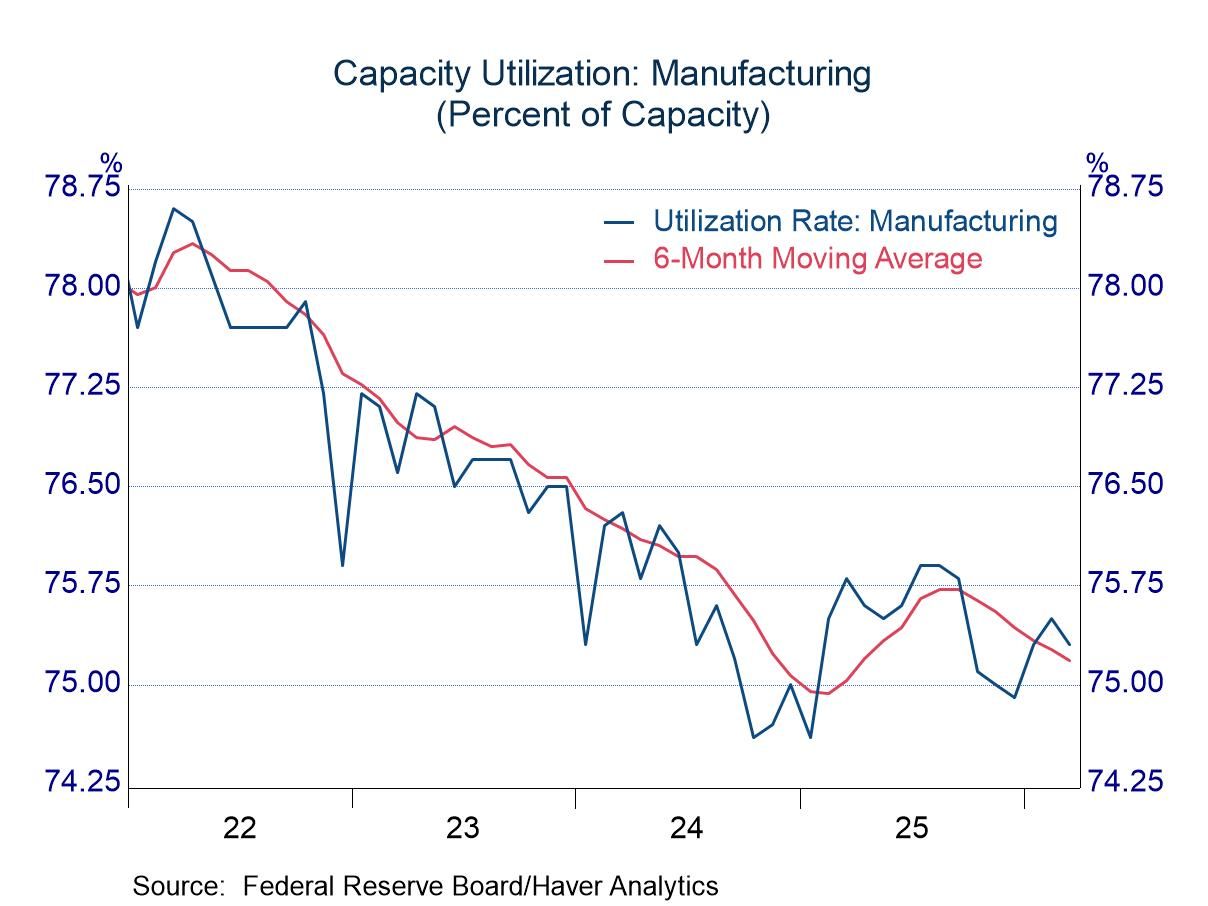
The capacity utilization rate in manufacturing has naturally reflected movement in production. Utilization rose in 2025 as production strengthened, but it retraced most of the upward movement once momentum in production faded. The utilization rate in manufacturing stood at 75.2% in March, down slightly from the average of 75.4% in 2025.
Industrial production and capacity data are in Haver’s USECON database. Additional detail on production and capacity utilization can be found in the IP database. The expectations figures come from the AS1REPNA database.

Michael J. Moran
AuthorMore in Author Profile »Before joining Haver Analytics in 2025, Michael J. Moran was the chief economist of Daiwa Capital Markets America Inc. He was responsible for preparing the firm’s economic forecast and interest rate outlook. He traveled frequently to visit the clients of Daiwa Capital Markets and wrote weekly economic commentary. Mr. Moran also was involved in the flux of financial markets, as he spent a portion of each day on Daiwa’s trading floor interpreting economic statistics and Federal Reserve activity for traders and salespeople. Mr. Moran is quoted frequently in the financial press, and he appears regularly on cable news shows. He also has published articles in several journals and periodicals. Before joining Daiwa Capital Markets America, Mr. Moran worked as an economist at the Federal Reserve Board in Washington, D.C. where he analyzed a broad range of issues dealing with the financial sector of the economy and regularly briefed the Board of Governors. He was on the faculty of Pennsylvania State University from 1979 to 1980 and taught on a part-time basis at George Washington University from 1980 to 1987.
Mr. Moran received his Ph.D. in economics from Pennsylvania State University in 1980 and a B.S. in business administration from the University of Bridgeport in 1975. He was a CFA charter holder from 2002 until 2016.
More Economy in Brief