U.S. CPI in Line with Expectations in July
by:Sandy Batten
|in:Economy in Brief
Summary
- The headline CPI increased 0.1% m/m in July with the core index rising 0.2% m/m, both in line with expectations.
- Y/Y rates for each index edged down 0.1%-point.
- Seasonally adjusted energy prices fell for the second consecutive month.
- Shelter prices rose only 0.1% m/m, but this was mostly due to a 3.3% m/m decline in hotel prices.
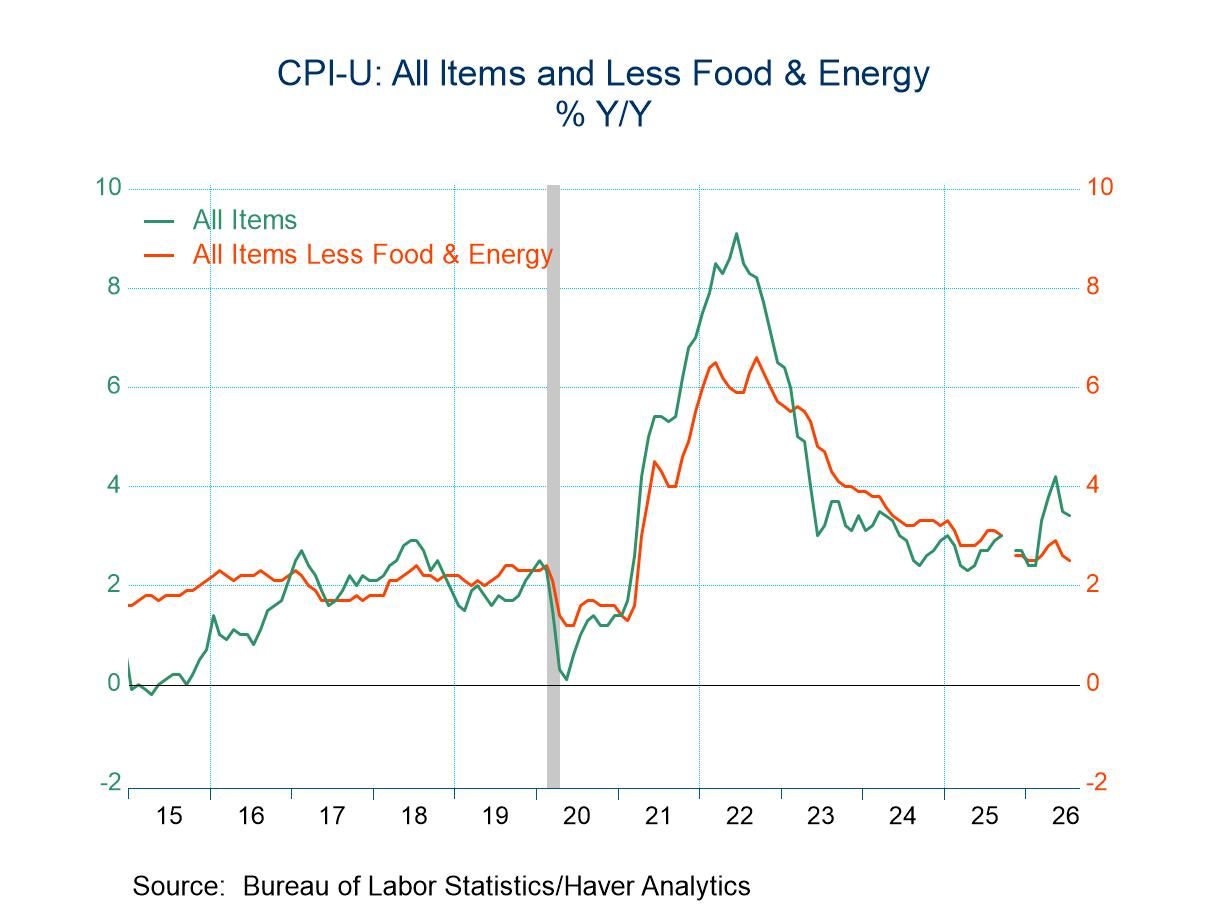
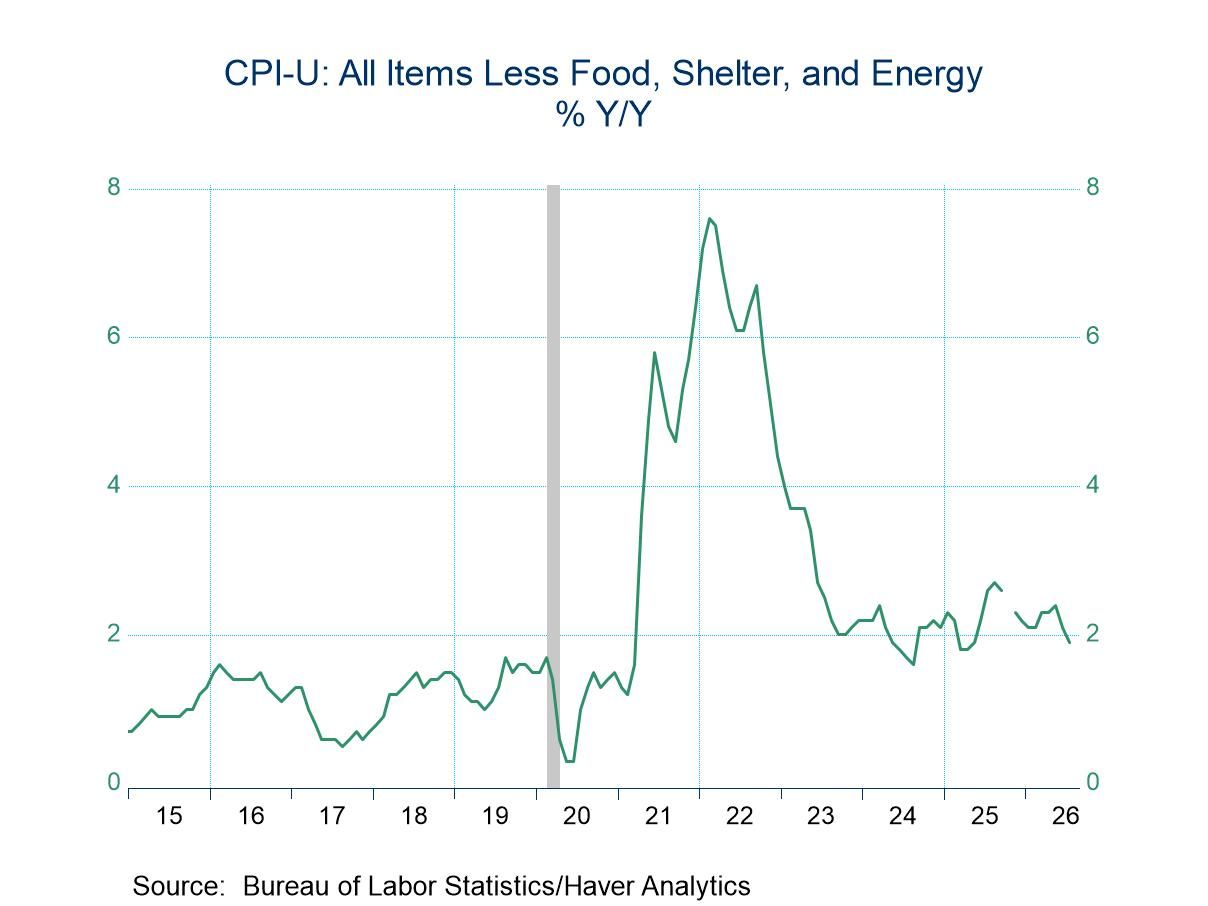
CPI increased 0.1% m/m (3.4% y/y) following a 0.4% monthly decline in June. The core index (excluding food and energy prices) rose 0.2% m/m (2.5% y/y) after having been unchanged in June. The Action Economics Forecast Survey expected a 0.1% monthly gain for the headline index and a 0.2% monthly increase for the core index. The 3-month rate for the headline index fell to 0.5% annualized in July from 2.8% in June while the 3-month rate for the core index slipped to 1.6% from 2.3% in June.
Combined with the weaker than expected employment report released last week, today’s in line with expectations inflation figures were generally interpreted as assuaging some of Fed’s inflation concerns. However, there is still another CPI report and another employment report before the next FOMC meeting in the middle of September.
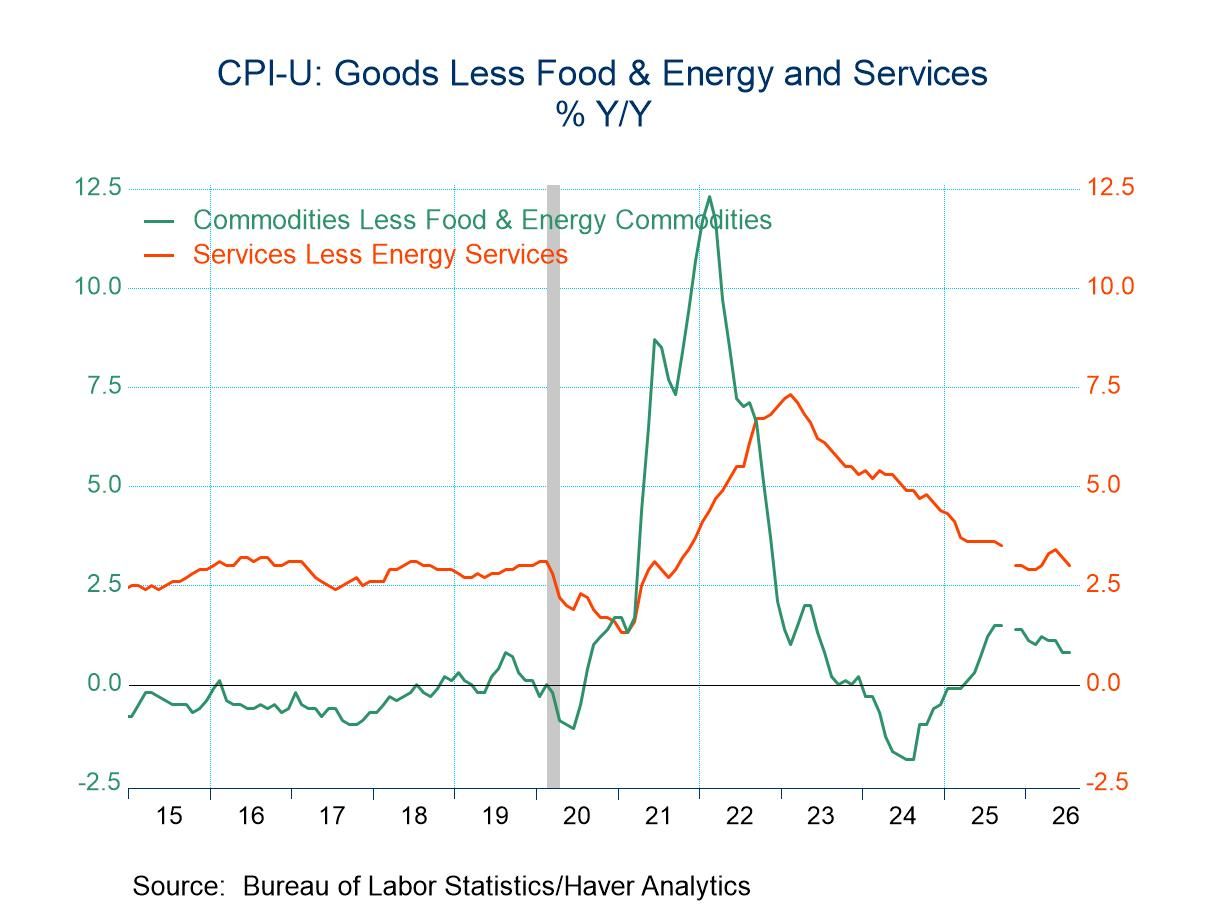
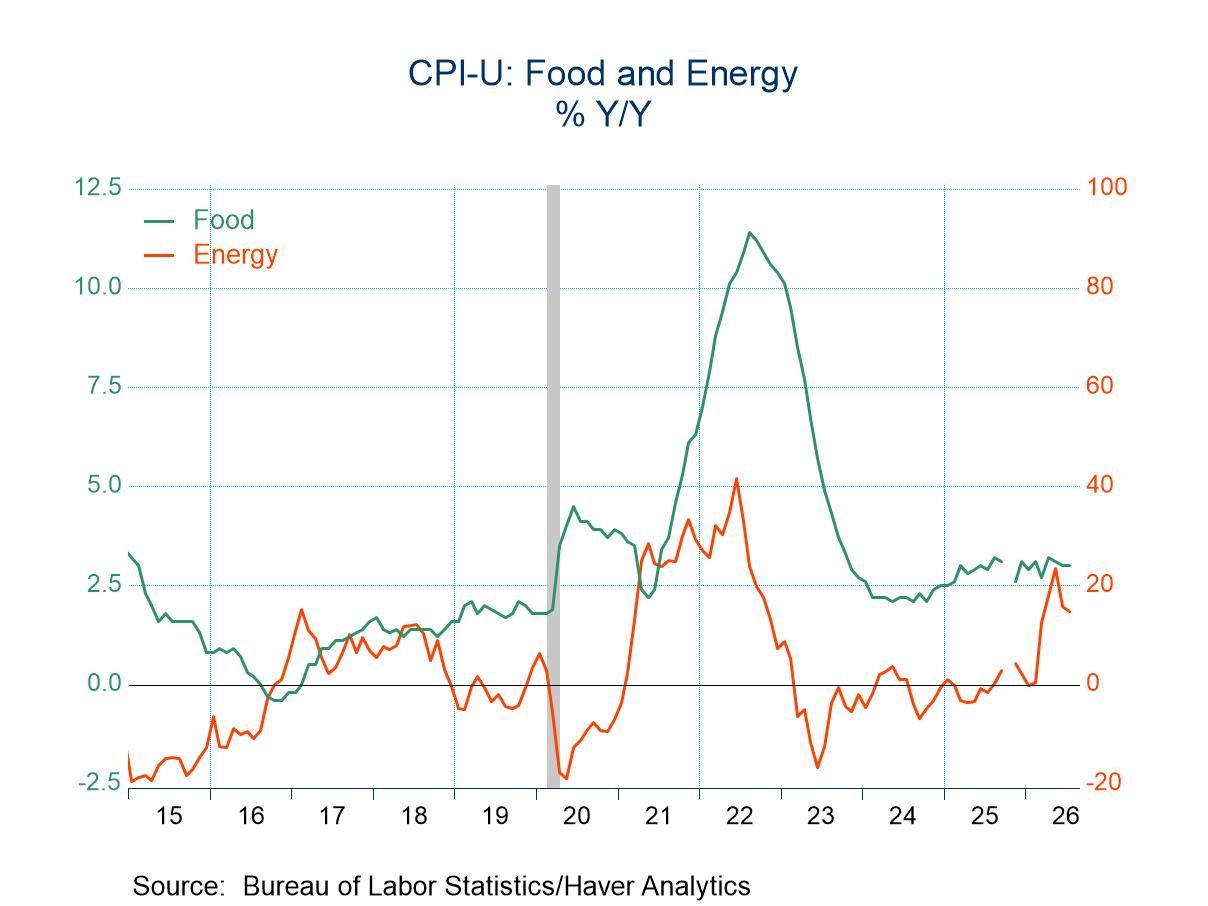
Energy prices continued to play a major role in July. Seasonally adjusted energy prices fell 1.5% m/m in July on top of a 5.7% monthly decline in June. Prices of energy commodities declined 2.9% m/m in July with the seasonally adjusted price of gasoline also falling 2.9% m/m while prices of energy services rose 0.3% m/m. Prices of goods other than energy increased 0.2% m/m (0.8% y/y) after 0.1% monthly declines in both May and June. Prices of services excluding energy also increased 0.2% m/m (3.0% y/y) after having been unchanged in June. Food prices edged up 0.1% m/m (3.0% y/y) in July, the smallest monthly increase in four months, down from 0.2% m/m in June.
There was a whole laundry list of price declines in June that held down the core index that many analysts felt were unsustainable. Consequently, how much these prices rebounded in July was thought to be key to the overall July outcome. Indeed, most of the declines highlighted in June were reversed in July but only modestly. The price of cell phone service plunged 3.3% m/m in June but rose 0.6% m/m in July. Apparel prices fell 0.6% m/m in June but edged up 0.1% m/m in July. Prices of medical care services slipped 0.1% m/m in June but rose 0.6% m/m in July. Used vehicle prices, which declined 0.2% m/m in June, rebounded 0.4% m/m in July. In contrast, hotel prices dropped 2.8% m/m in June and declined 3.3% m/m in July. Prices of vehicle insurance decreased 2.0% m/m in June and added a 0.3% m/m decline in July.
The second consecutive outsized decline in hotel prices held down the rise in shelter costs in July, which increased just 0.1% m/m (3.2% y/y), the same monthly gain as in June. Still, this modest rise in shelter costs accounted for 2/3 of the monthly increase in the overall CPI. However, rent and owners’ equivalent rent were not as tame as overall shelter costs. Rent of primary residence increased 0.3% m/m (2.9% y/y) following a 0.1% monthly increase in June. Owners’ equivalent rent increased 0.3% m/m (3.2% y/y) versus a 0.2% monthly gain in June.
CPI services prices less energy services and the two rent measures is a relatively new core measure that is watched carefully by the Federal Reserve. It increased 0.2% m/m in July after having fallen 0.2% m/m in June with the y/y rate declining to 2.8% from 3.1% in June. Somewhat encouraging, the July y/y reading is almost at the top of the range in which this measure fluctuated prior to the pandemic.
The Consumer Price figures can be found in Haver's USECON database. The expectations figure is contained in the AS1REPNA database.

Sandy Batten
AuthorMore in Author Profile »Sandy Batten has more than 30 years of experience analyzing industrial economies and financial markets and a wide range of experience across the financial services sector, government, and academia. Before joining Haver Analytics, Sandy was a Vice President and Senior Economist at Citibank; Senior Credit Market Analyst at CDC Investment Management, Managing Director at Bear Stearns, and Executive Director at JPMorgan. In 2008, Sandy was named the most accurate US forecaster by the National Association for Business Economics. He is a member of the New York Forecasters Club, NABE, and the American Economic Association. Prior to his time in the financial services sector, Sandy was a Research Officer at the Federal Reserve Bank of St. Louis, Senior Staff Economist on the President’s Council of Economic Advisors, Deputy Assistant Secretary for Economic Policy at the US Treasury, and Economist at the International Monetary Fund. Sandy has taught economics at St. Louis University, Denison University, and Muskingun College. He has published numerous peer-reviewed articles in a wide range of academic publications. He has a B.A. in economics from the University of Richmond and a M.A. and Ph.D. in economics from The Ohio State University.
More Economy in Brief
 Asia
Asia