Asia| Nov 16 2026
Economic Letter from Asia: What a Year
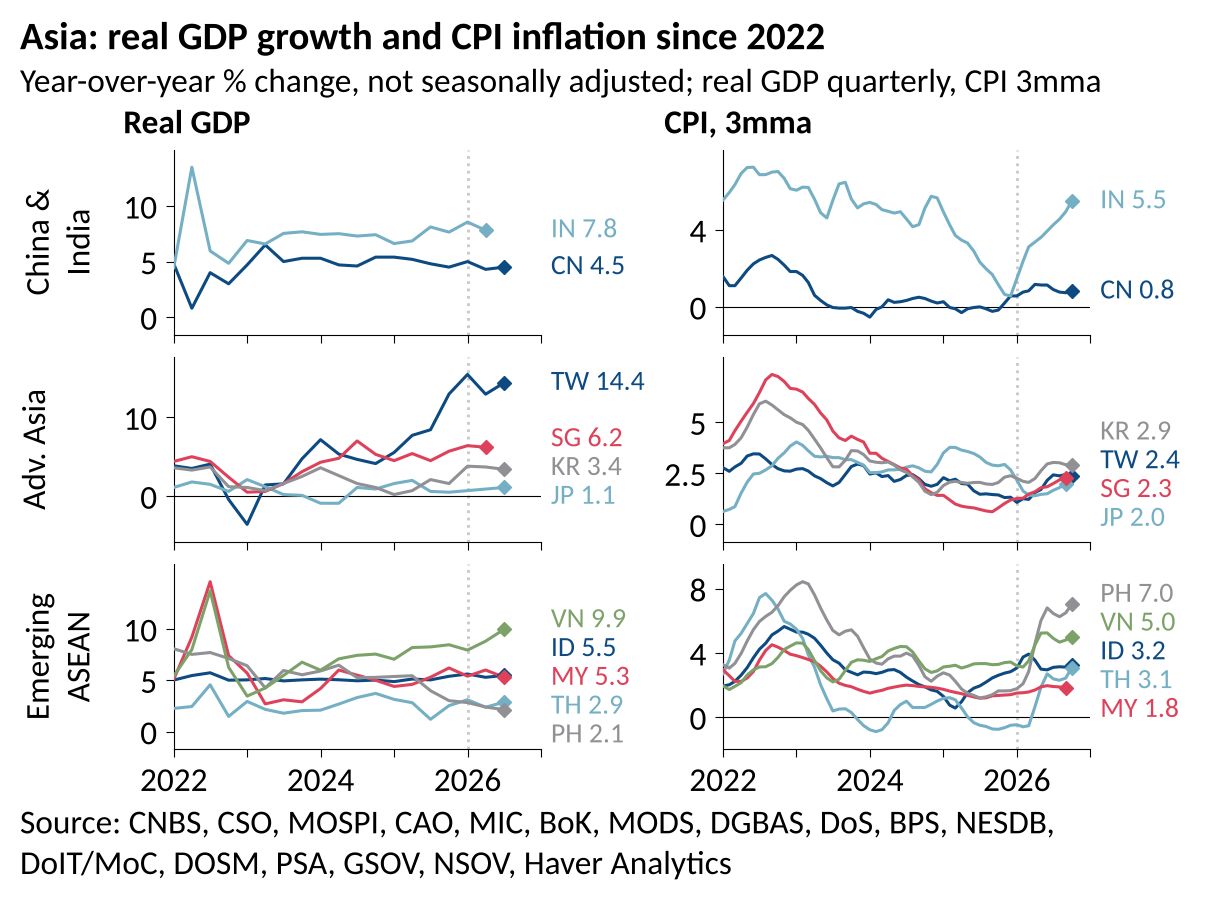
In this week’s Letter, we begin our look back at 2026, a year in which AI and a Gulf energy shock pulled Asia’s economies apart. Over the coming weeks we will revisit the year’s key developments and events, and look ahead to what may matter most in 2027. We start with the growth and inflation outturns (chart 1). Economies tied to the semiconductor cycle, such as Taiwan, Vietnam and Singapore, have led, while India has grown on domestic investment and services. The Philippines and Thailand have lagged, held back by politics, weak demand and the oil shock. The chip boom itself has driven a large share of export growth in South Korea, Taiwan and Singapore, lifting growth forecasts for the first two (chart 2). In China, integrated circuits have become the largest export category, riding strong demand even for chips short of the frontier (chart 3). Yet the gains have not reached households (chart 4). Retail sales and investment remain weak, and the long-discussed rebalancing towards consumption looks harder to prioritise while external demand stays strong. Energy has been the year’s other defining force. Food has driven India’s inflation higher and fuel has driven the Philippines’, while subsidies and tax cuts elsewhere have moved the strain from household budgets to public finances (chart 5). Finally, these currents have shaped monetary policy. Indonesia, the Philippines, South Korea and India have hiked for a mix of currency, inflation and financial stability reasons (chart 6). Thailand has cut, several central banks have held, and Japan continues its gradual normalisation.
Growth and inflation Asia’s growth outturn this year has been sharply uneven, with the dividing lines drawn by exposure to the AI boom, energy dependence and domestic politics (chart 1). The clear outperformers are economies plugged into the semiconductor cycle. Taiwan’s real GDP grew 14.4% y/y in the latest quarter, Vietnam’s 9.9% and Singapore’s 6.2%. India’s 7.8% has instead leaned on domestic drivers. At the other end sit the Philippines (2.1%) and Thailand (2.9%). In the Philippines, a flood control corruption scandal has delayed public works, while the oil shock has eaten into household spending. Thailand remains weighed down by weak demand and heavy household debt. Inflation shows a similar split. Headline CPI has climbed to 7.0% (y/y 3mma) in the Philippines and 5.5% in India, on food and energy. China, by contrast, sits at 0.8% even though producer prices rose 5.7% y/y in October. We explore these threads below.
Chart 1: Growth and inflation in Asia
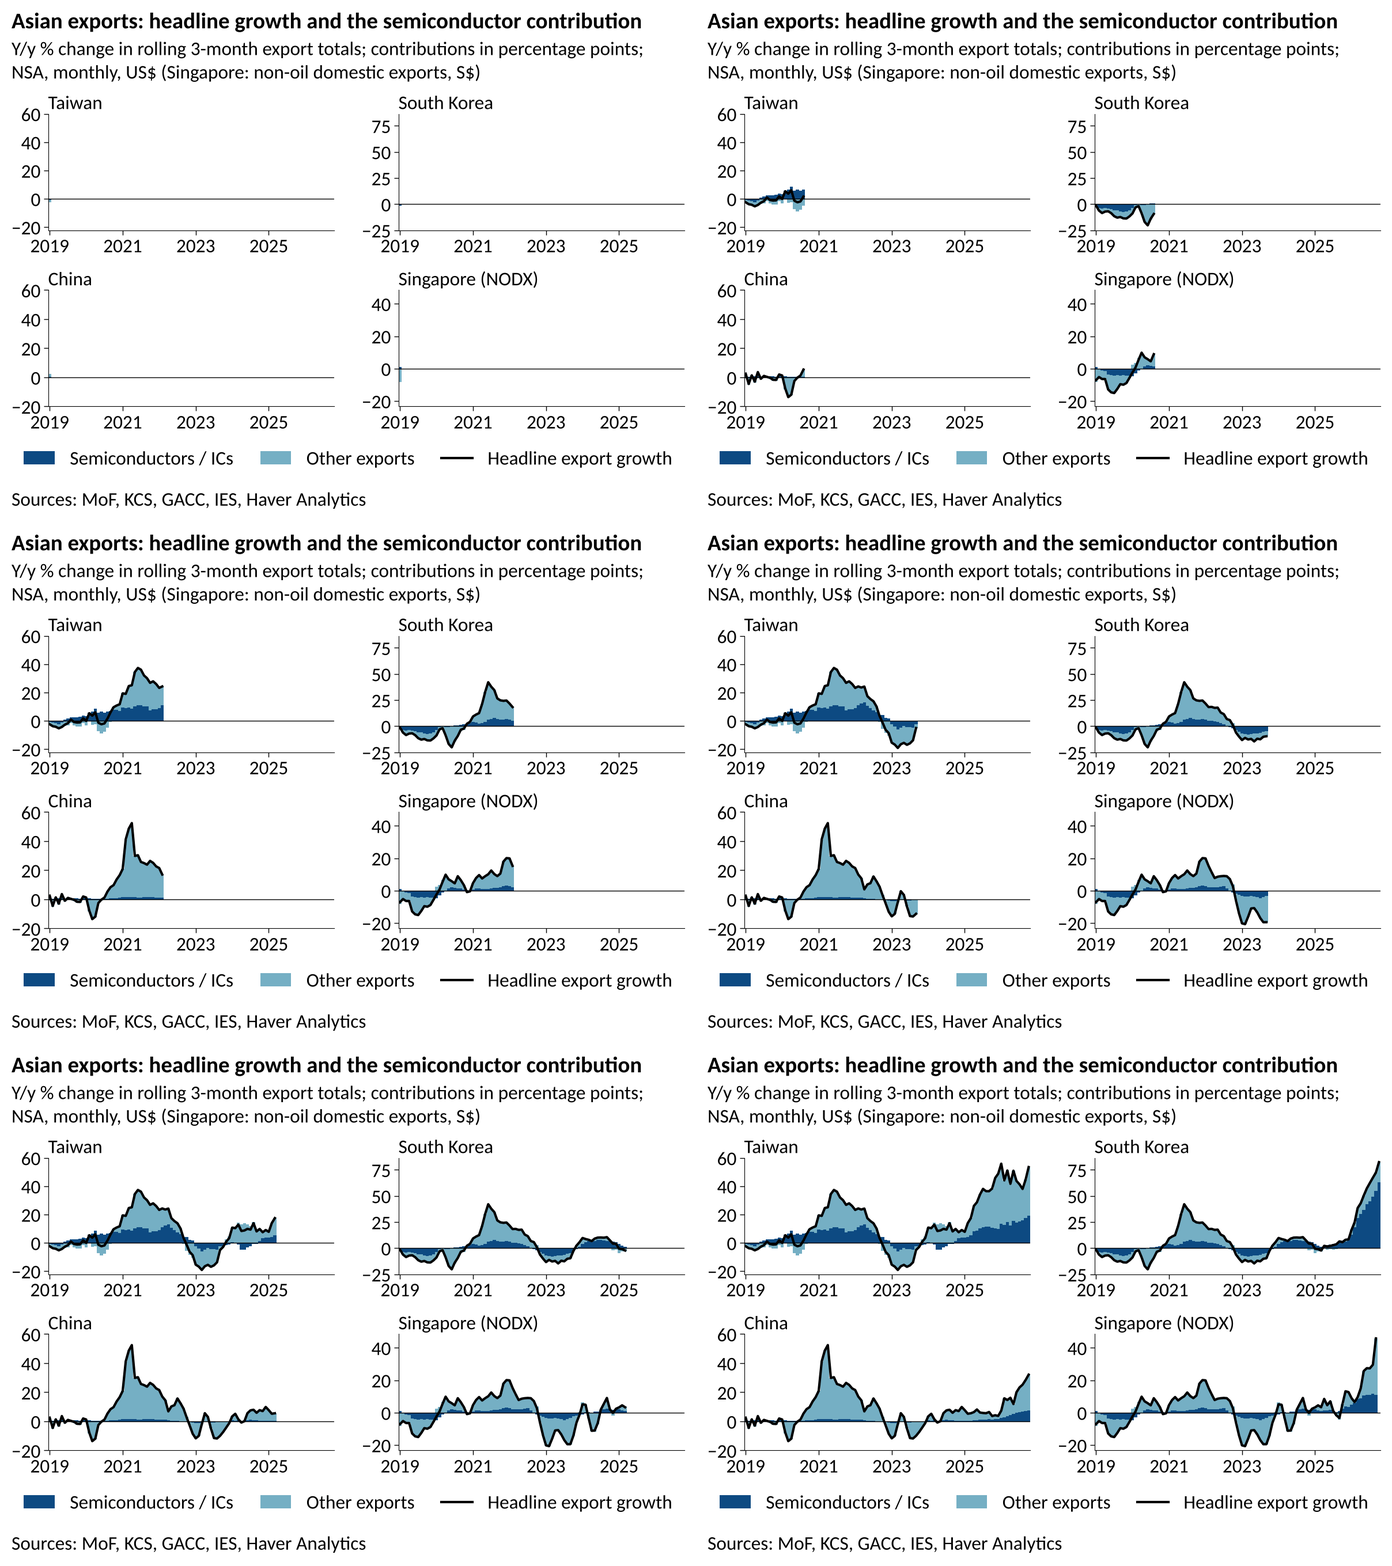
The AI boom Semiconductors have been the single biggest swing factor in Asia’s trade this year (chart 2). In South Korea, chips account for roughly 65pp of headline export growth of around 80% y/y on a rolling three-month basis. Taiwan’s exports are up more than 50% y/y, with semiconductors contributing close to 20pp. Singapore’s non-oil domestic exports have surged past 40% y/y, with chips adding over 10pp. This has lifted growth expectations. The IMF’s October outlook has Taiwan growing 10.7% this year. It sees South Korea at 3.3%, up from 1.1% in 2025, with semiconductor demand driving both. In Korea, the central bank expects the boom to spread beyond exports into corporate earnings, investment and wages. China’s case is different. Chips add a more modest 7pp or so to its export growth, but they have helped offset a domestic economy that continues to underwhelm. We turn to China next.
Chart 2: Semiconductor / integrated circuits exports contributions in Asia
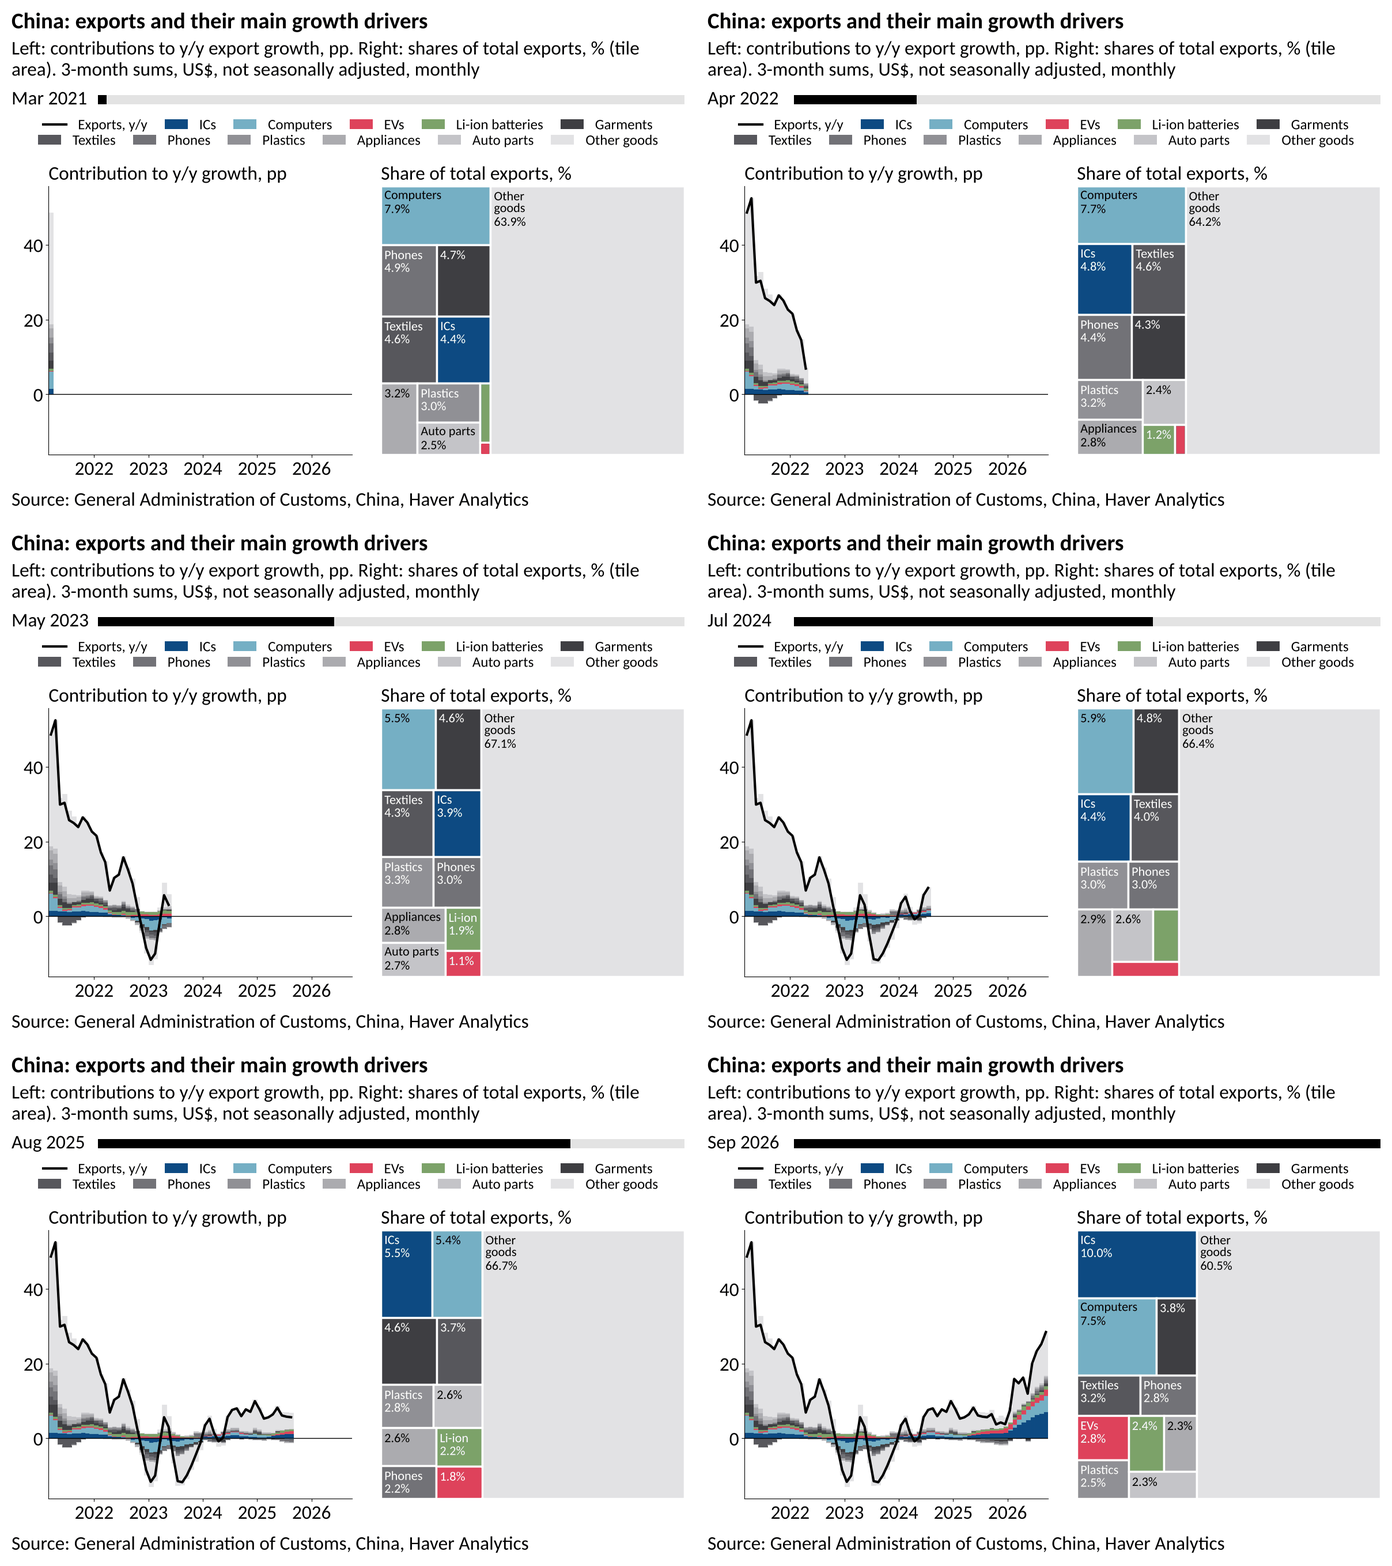
China Integrated circuits have risen to the top of China’s export mix (chart 3). They made up 10.0% of total exports in the three months to September, the largest single category shown, ahead of computers at 7.5%. Garments (3.8%) and textiles (3.2%), long staples of the export basket, now trail well behind. ICs have also become the largest contributor to export growth, adding around 7pp to a headline rate close to 30% y/y. This reflects the broader AI boom. China’s chips are not yet at the frontier, but global demand has surged even for less advanced chips, with its semiconductor exports having risen 96% y/y in the first half of 2026. Other goods, however, still carry weight. EVs (2.8%), phones (2.8%) and lithium-ion batteries (2.4%) each hold meaningful shares, and EVs and batteries have added modestly to growth. Together, these shares show a basket tilting towards higher-value manufactured goods.
Chart 3: China’s export drivers
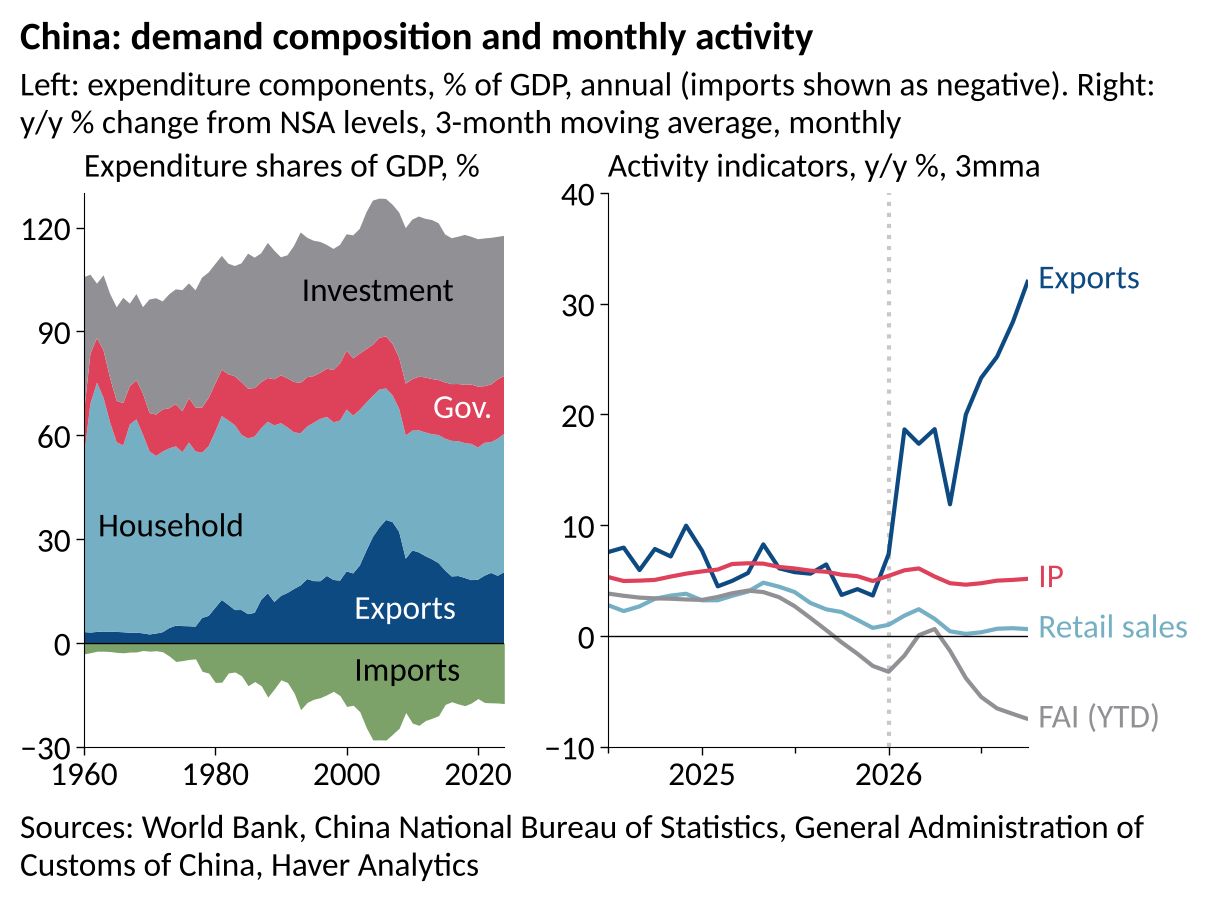
China is capturing part of the rents from the AI boom, but the gains have yet to filter through to its domestic economy (chart 4, right). On the external side, export growth has accelerated to over 30% y/y on a three-month average basis. Industrial production, which tracks the external sector more closely, has held near 5%. At home, the picture is far weaker. Retail sales growth has slowed below 1% and fixed asset investment is down more than 7% YTD. Prices point the same way, with CPI at 0.7% y/y in October even as producer price inflation reached 5.7%. The IMF reached a similar view, noting that Q2 growth of 4.3% fell short of expectations as robust exports only partly offset weak consumption and investment amid property strains. Structurally, household spending has hovered around 40% of GDP for decades, and calls to rebalance towards consumption are not new (chart 4, left). Yet with external demand still strong and domestic conditions weak, rebalancing may now be harder to place at the top of the policy agenda.
Chart 4: China’s demand composition and monthly activity indicators
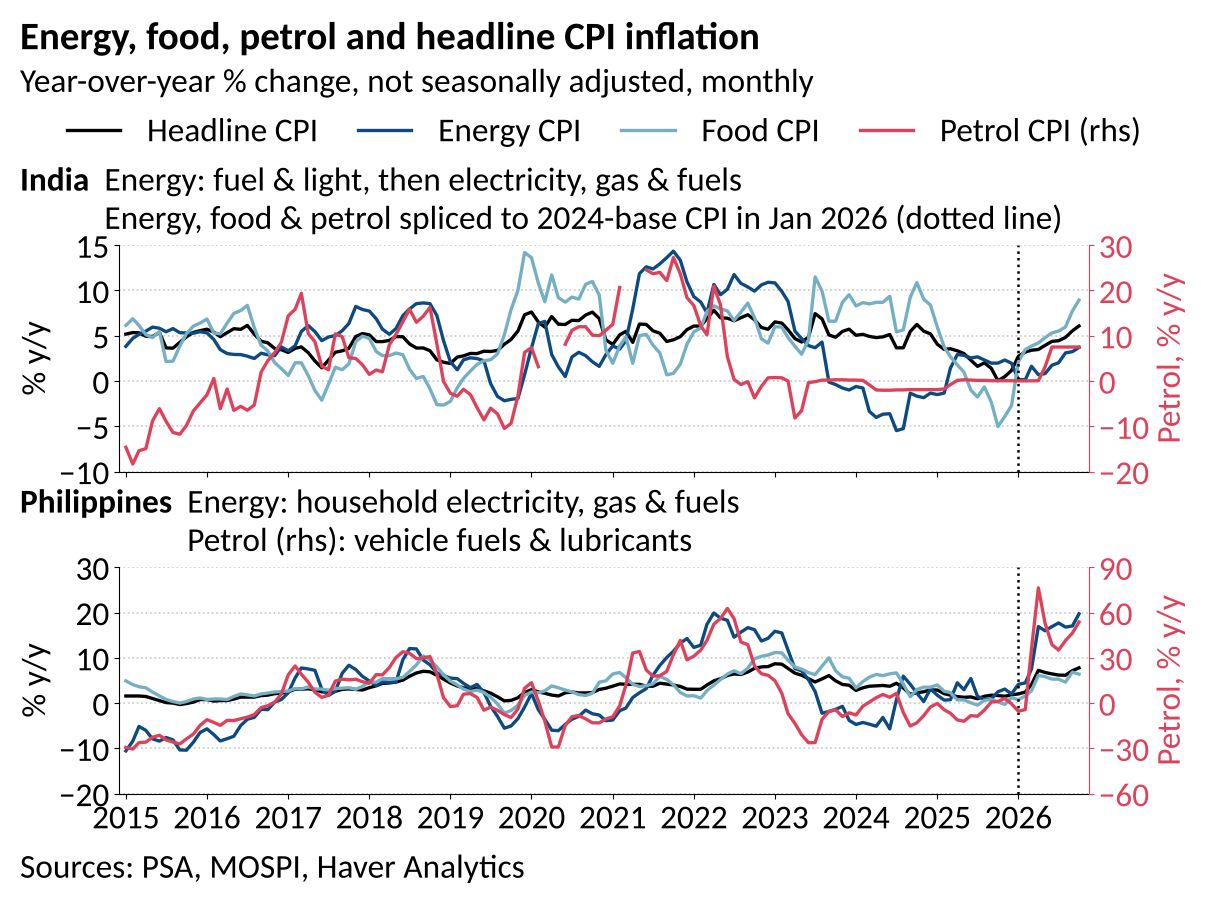
Energy woes Inflation has surged in India and the Philippines this year, though through different channels (chart 5). In India, headline CPI rose to 6.09% y/y in October, breaching the RBI’s 6% upper tolerance limit, with food inflation at 8.94%. Energy and petrol CPI have risen far less. In the Philippines, energy is the main driver: headline inflation reached 7.8% in October, the highest since February 2023, as transport inflation jumped to 20.1%. In India, the oil shock shows up more clearly in wholesale prices. Wholesale inflation reached 12.29% y/y in October, with fuel and power WPI up 32.84%, from 25.85% in September. Retail fuel prices, by contrast, have been cushioned by an INR 10 per litre excise cut on petrol and diesel. Elsewhere, subsidies do similar work. Indonesia has frozen subsidised Pertalite at IDR 10,000 per litre through the end of 2026, on a budget that assumed USD 70 per barrel crude oil price. Such measures shift the strain from households to public finances, and they cannot be sustained indefinitely.
Chart 5: Inflation in India and the Philippines
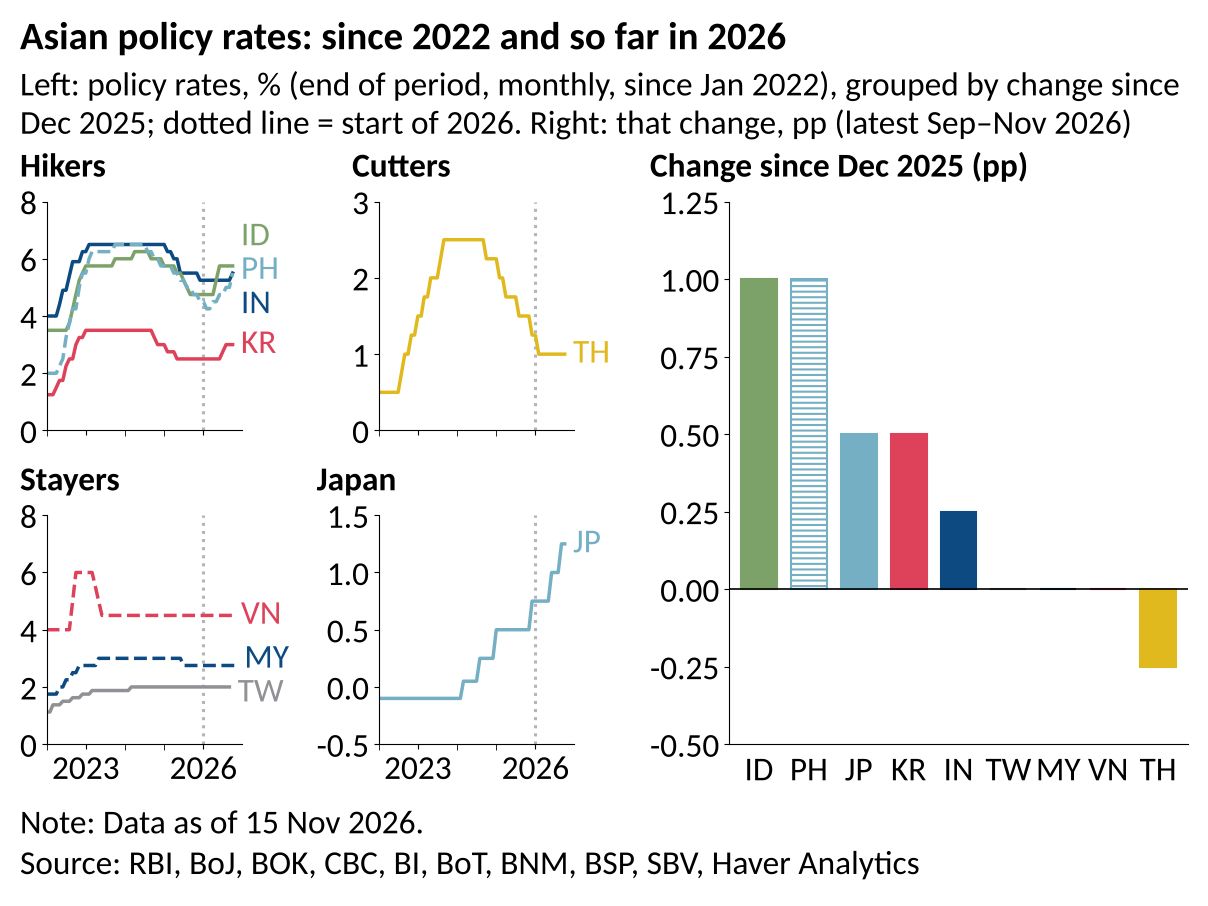
Monetary policy These forces have run through the year’s monetary policy decisions (chart 6). The AI boom has given some central banks room to tighten, while the energy shock has pushed others to hike despite softer domestic conditions. Bank Indonesia and the BSP have each raised rates by a net 100bp since December 2025. BI’s hikes in May and June aimed partly at stabilising the rupiah, while the BSP has hiked into energy-driven inflation even as growth slowed. The Bank of Korea added 50bp in back-to-back moves, as chip-led growth gave it room to lean against above-target inflation, Seoul housing and household debt. The RBI raised its repo rate 25bp to 5.50% in October, its first hike since February 2023, with the rupee near record lows. Thailand is the lone cutter, easing to 1.00% in February to support a struggling economy. Taiwan, Malaysia and Vietnam have stayed put. Japan is a case apart. Two hikes this year have taken the BoJ to 1.25%, only now near the bottom of its estimated 1.1% to 2.5% neutral range.
Chart 6: Monetary policy rates in Asia

Tian Yong Woon
AuthorMore in Author Profile »Tian Yong joined Haver Analytics as an Economist in 2023. Previously, Tian Yong worked as an Economist with Deutsche Bank, covering Emerging Asian economies while also writing on thematic issues within the broader Asia region. Prior to his work with Deutsche Bank, he worked as an Economic Analyst with the International Monetary Fund, where he contributed to Article IV consultations with Singapore and Malaysia, and to the regular surveillance of financial stability issues in the Asia Pacific region.
Tian Yong holds a Master of Science in Quantitative Finance from the Singapore Management University, a Master of Science in Analytics from the Georgia Institute of Technology, a Bachelor of Science in Mathematics from the Singapore University of Social Sciences, and a Bachelor of Science in Banking and Finance from the University of London.
More Economy in Brief