Global| Nov 12 2026
Charts of the Week: Cheaper Energy, Dearer Money
by:Andrew Cates
|in:Economy in Brief
Summary
The world economy faces an unusual combination: cheaper energy but dearer money. Brent crude has fallen from more than $135 a barrel in early October to around $91, as hopes of a negotiated settlement in the Middle East have grown. For energy importers, this offers welcome relief from cost pressures and a boost to real incomes. Bond markets initially responded in kind: the ten-year US Treasury yield fell from 5.31 per cent in early October to 4.84 per cent at the start of November. But that relief has proved short-lived. Stronger-than-expected US core inflation has pushed the yield back towards 5 per cent and reduced expectations of monetary easing. This tension runs through this week's charts. Global economic momentum has softened, though activity remains resilient (chart 1). Beneath the surface, however, the sources of growth have become increasingly concentrated. China's export expansion is being driven by technology (chart 2), while the US profits recovery rests heavily on finance and information (chart 3). Both trends underline the growing importance of technology and capital markets to the global outlook. Meanwhile, oil inventories have remained relatively comfortable despite severe supply disruptions, suggesting that cheaper energy may offer more lasting relief (chart 4). But the monetary outlook is less encouraging. Blue Chip forecasters have raised their interest-rate projections by more than their inflation expectations (chart 5) in recent months, while recent core inflation readings suggest that underlying price pressures remain stubborn (chart 6). The result is an uneasy combination: improving supply conditions should support growth, but persistently high borrowing costs threaten an expansion increasingly dependent on technology investment. Whether cheaper energy can outweigh dearer money is becoming a key question.
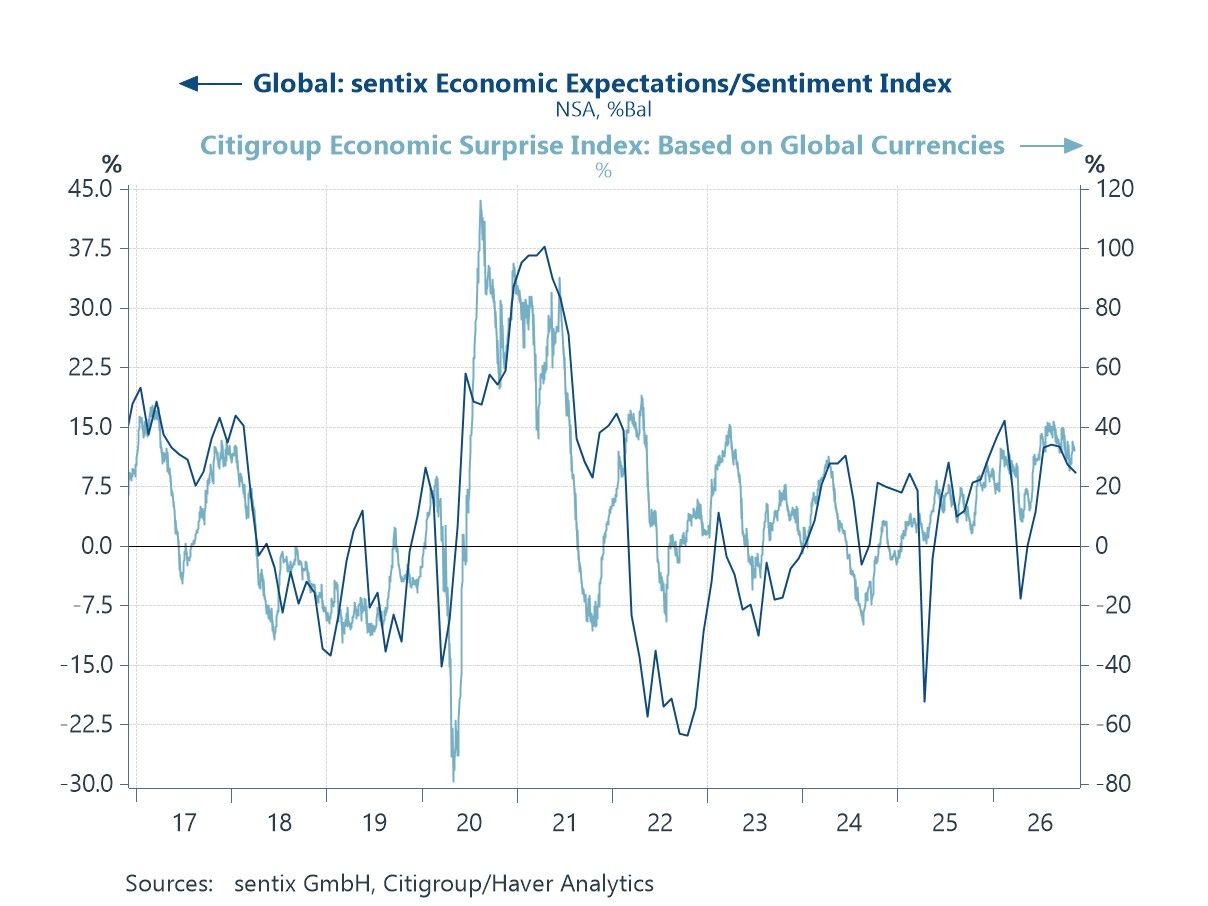
Momentum past its peak The global economy is losing momentum, but not yet its resilience. The sentix index of world economic expectations fell for a third consecutive month in November, retreating from its August peak but remaining comfortably in positive territory. The Citigroup global growth surprise index tells a similar story. Although it has eased from its summer highs, it remains firmly positive, suggesting that incoming economic data continue to exceed expectations, albeit by a diminishing margin. Both indicators therefore point to a moderation rather than a reversal in economic momentum. The global economy is still performing better than expected, but the improvement in sentiment and the flow of positive surprises are becoming less pronounced (chart 1).
Chart 1: Global economic expectations and the global economic surprise index
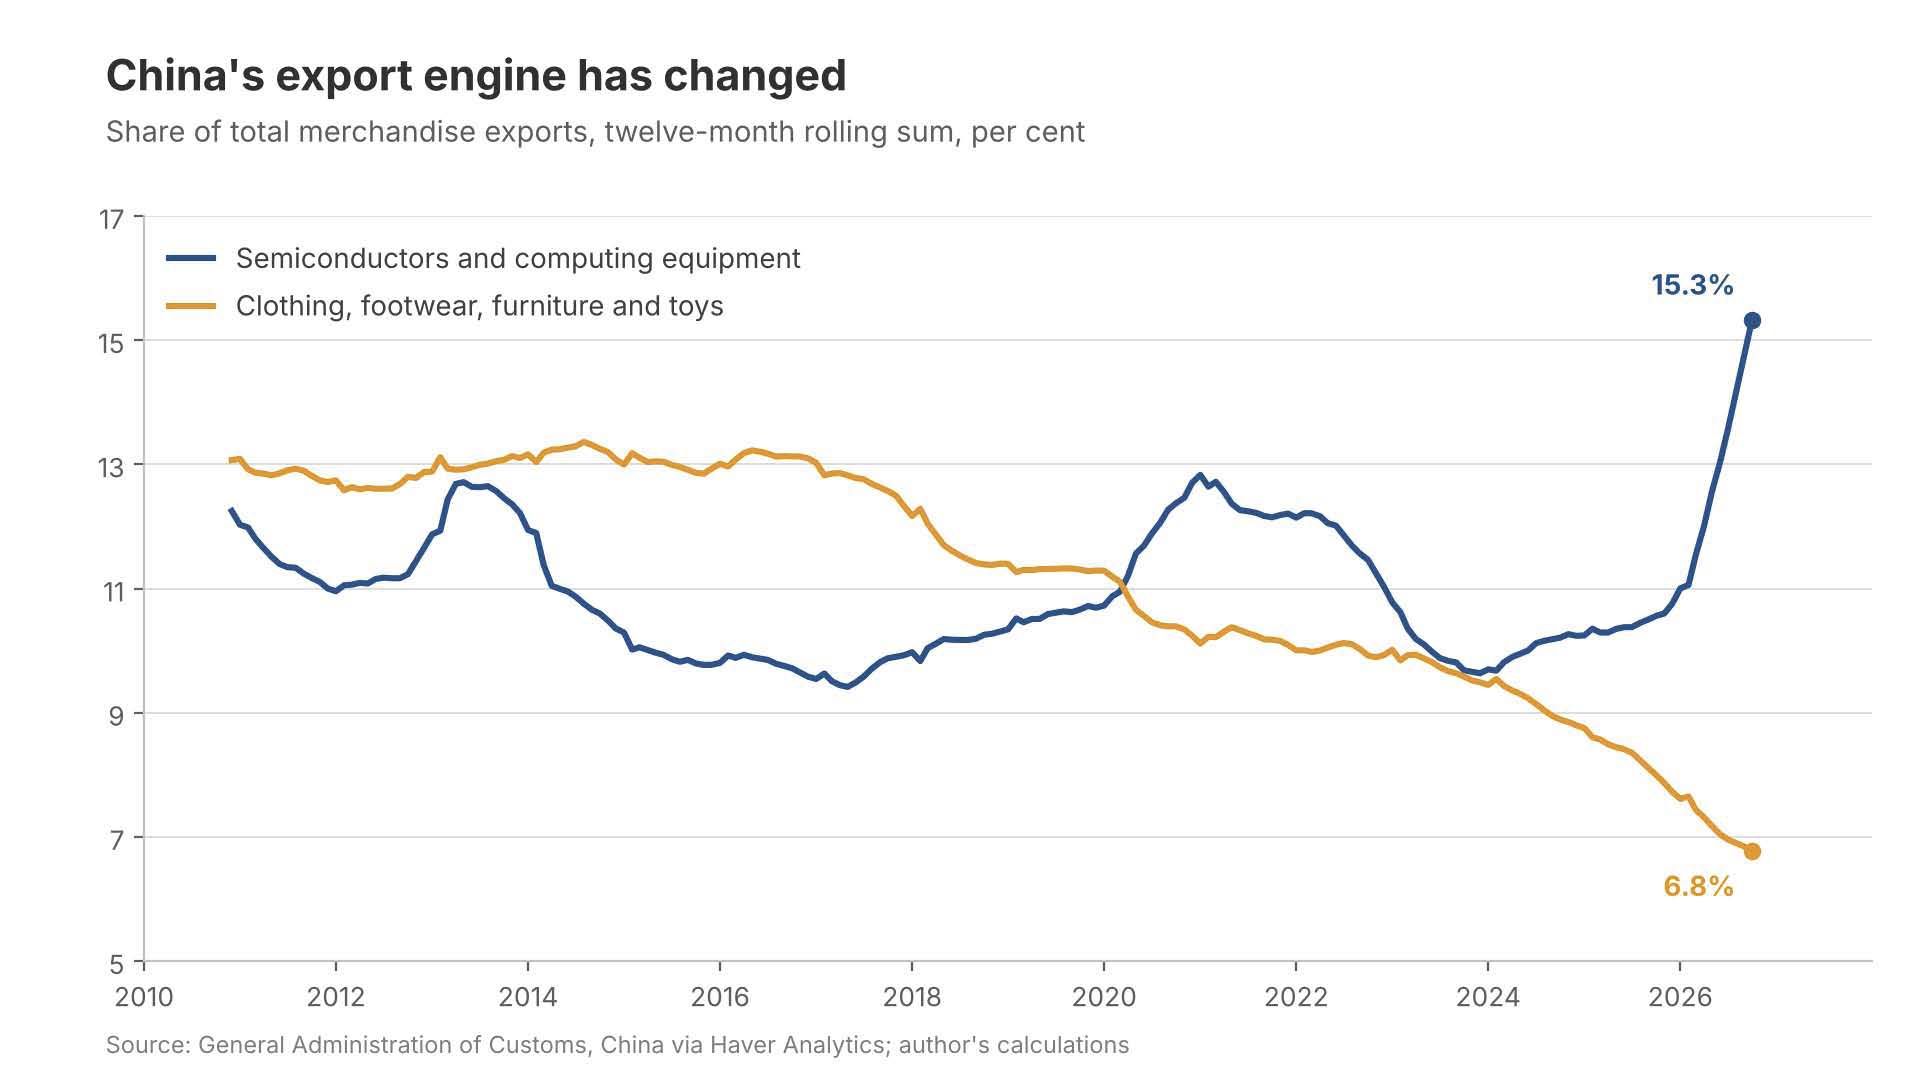
China's new export engine China's export boom is changing character. Traditional manufactured goods, from clothing to furniture, are steadily losing ground in the export mix as semiconductors and computing equipment take a larger share. This is not simply a story of old industries contracting: their export values have also risen. Rather, the extraordinary expansion of technology-related trade, fuelled by AI investment, is changing the balance of China's external sector and, with it, the nature of its influence on global trade. One important caution remains. The surge in semiconductor prices means that higher export receipts cannot be read as an equivalent increase in the volume of goods shipped. Even so, the direction of the structural shift is unmistakable (chart 2).
Chart 2: Chinese merchandise exports by product group, share of the total
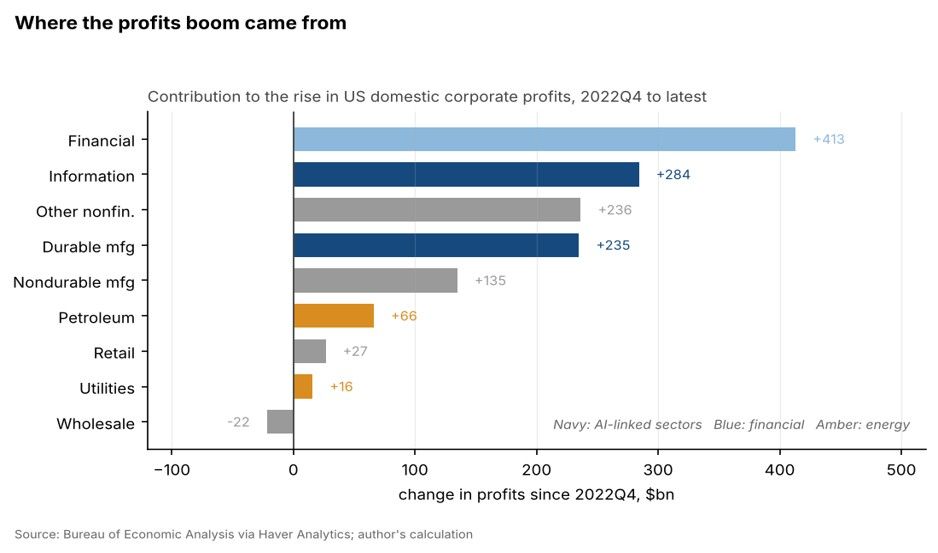
A profits boom with few owners The US corporate profits recovery looks impressive in aggregate, but its foundations are narrow. Finance and information have supplied an outsized share of the improvement in recent years, with durable goods manufacturing also making a substantial contribution. Elsewhere, gains have been modest. This matters because the businesses driving the recovery are closely tied to capital-market conditions, technology spending and the availability of finance. A broad-based profits expansion might withstand prolonged monetary restraint more easily. One concentrated in a few capital-sensitive sectors is potentially more exposed if borrowing costs remain elevated or investors become less willing to fund ambitious investment plans (chart 3).
Chart 3: Contributions to the rise in US domestic corporate profits since the end of 2022
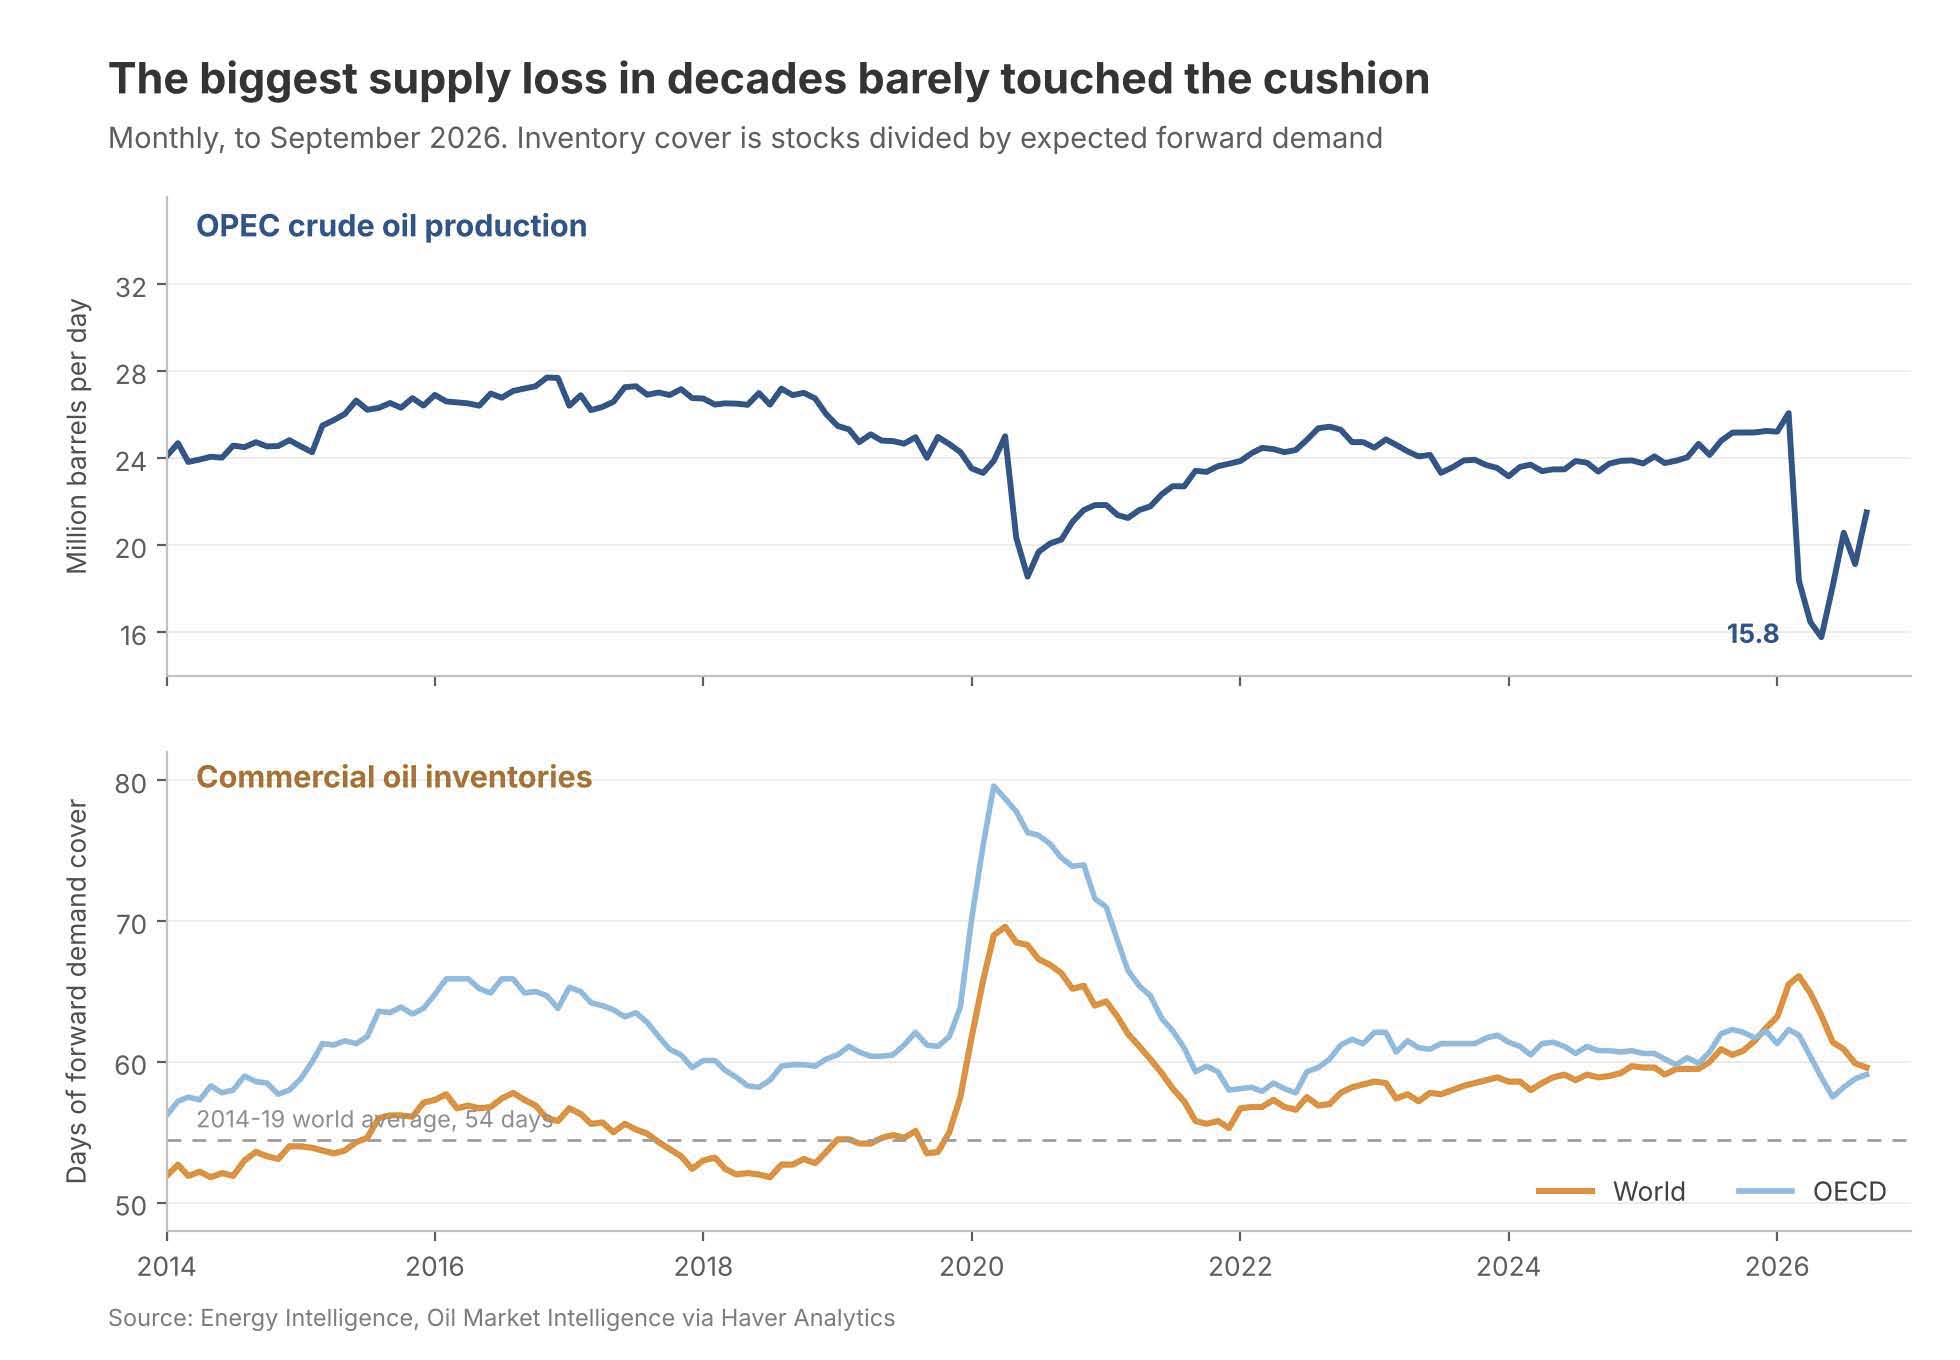
The cushion that was never tested The world oil market has absorbed an extraordinary disruption with more resilience than might have been expected. OPEC production fell dramatically earlier this year, yet global commercial inventories did not suffer a comparable collapse. Stocks have since declined, but the amount of oil held relative to expected demand remains comfortably above its pre-pandemic norm. This does not prove that supply was plentiful throughout the crisis. It does suggest that the market entered the shock with a meaningful buffer, limiting the pressure on available supplies. If production recovers as geopolitical tensions ease, that cushion could help keep prices under downward pressure. For energy importers, the resulting relief could prove economically significant (chart 4).
Chart 4: OPEC crude oil production and commercial oil inventory cover
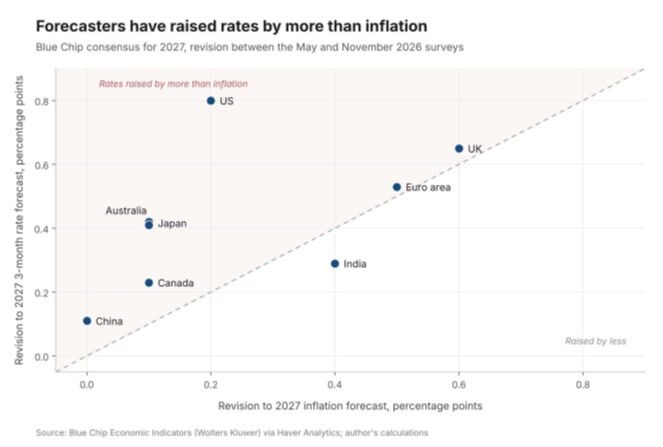
Rates marked up, prices less so The latest Blue Chip Economic Indicators survey points to a notable shift in the outlook for monetary policy. Across most of the major economies shown, forecasters have raised their projections for short-term interest rates in 2027 by more than their inflation forecasts. The divergence is particularly marked in the US, with Japan and Australia showing a similar pattern. In the UK and the euro area, the changes have been more evenly balanced. The implication is that the expected cost of borrowing has risen in real as well as nominal terms across much of the group. This is an important distinction. Markets and forecasters are not simply responding to a higher inflation outlook; they increasingly anticipate that central banks will need to maintain restrictive policy for longer (chart 5).
Chart 5: Revisions to the 2027 consensus for inflation and short-term interest rates
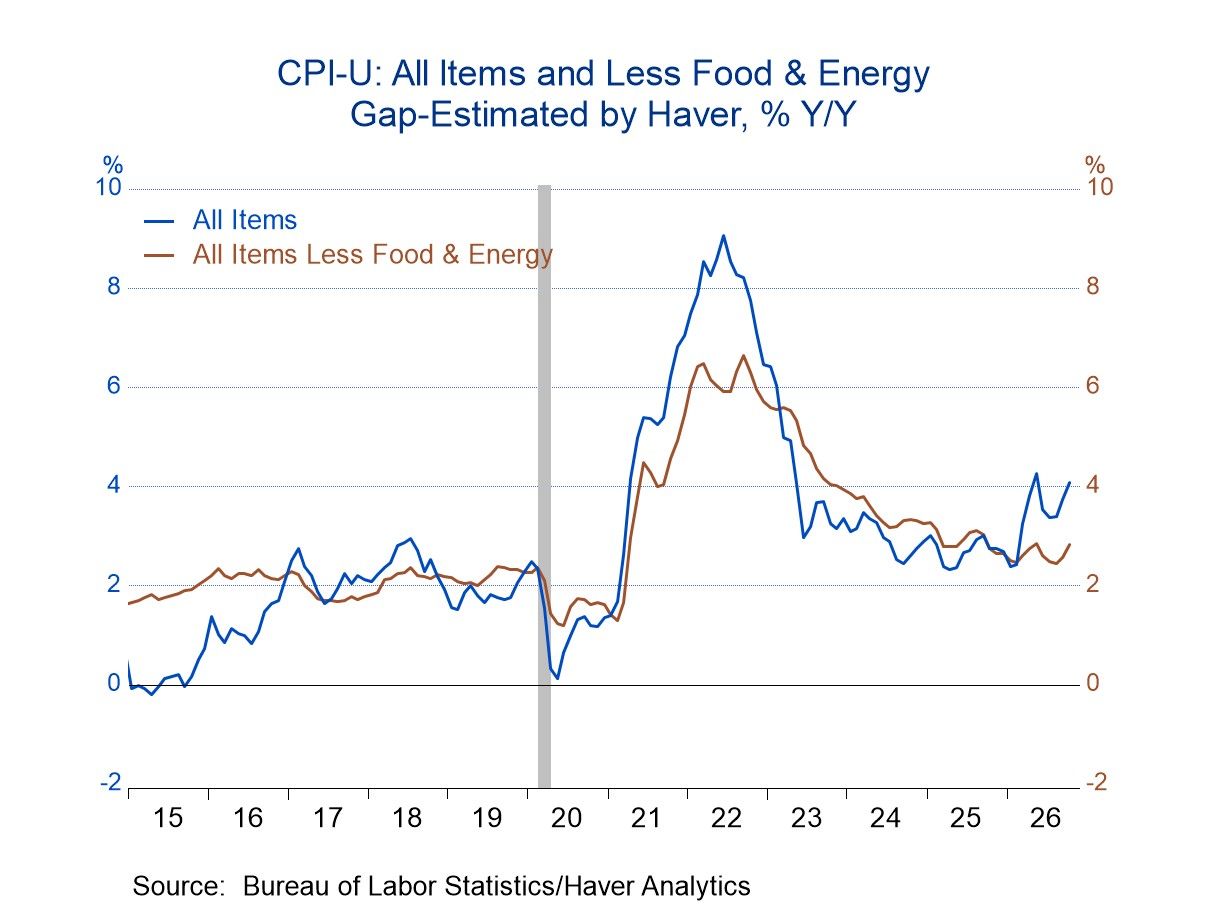
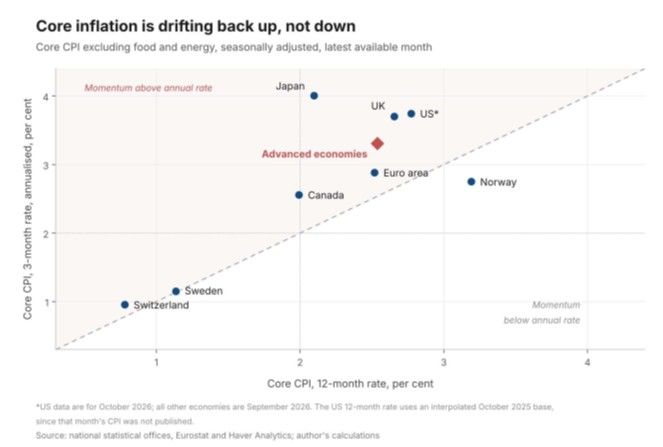
The annual rate flatters One reason for this reassessment may lie in the recent behaviour of underlying inflation. Although annual core inflation rates suggest that disinflation has made considerable progress, shorter-term measures tell a less reassuring story. Across much of the advanced world, core prices have been rising faster in recent weeks than the annual figures imply, notably in the US and Japan. This matters because annual comparisons can obscure a renewed acceleration in price pressures. Short-term readings are admittedly volatile, and a few firm observations do not establish a lasting reversal. Nevertheless, the breadth of the recent pickup suggests that the final stages of disinflation may prove more difficult than anticipated, reinforcing the case for central banks to keep interest rates higher for longer (chart 6).
Chart 6: Core consumer price inflation, annual rate and three-month annualised rate

Andrew Cates
AuthorMore in Author Profile »Andy Cates joined Haver Analytics as a Senior Economist in 2020. Andy has more than 25 years of experience forecasting the global economic outlook and in assessing the implications for policy settings and financial markets. He has held various senior positions in London in a number of Investment Banks including as Head of Developed Markets Economics at Nomura and as Chief Eurozone Economist at RBS. These followed a spell of 21 years as Senior International Economist at UBS, 5 of which were spent in Singapore. Prior to his time in financial services Andy was a UK economist at HM Treasury in London holding positions in the domestic forecasting and macroeconomic modelling units. He has a BA in Economics from the University of York and an MSc in Economics and Econometrics from the University of Southampton.
More Economy in Brief