 Global| Apr 09 2026
Charts of the Week: From Oil Shock to Policy Dilemma
by:Andrew Cates
|in:Economy in Brief
Summary
Amid further tentative signs of de-escalation—most notably President Trump’s decision on April 7th to step back from further escalation—financial markets have stabilised somewhat, but the macroeconomic implications of the Middle East crisis remain highly uncertain. As our charts show, the global economy entered this shock from a position of relative strength, with positive growth surprises and easing inflation pressures still evident in the data (chart 1). However, that benign backdrop now looks vulnerable. Central banks are already reassessing the outlook, with expectations for policy easing being pared back (chart 2) and a growing consensus that any response to persistent energy-driven inflation will likely involve delaying cuts rather than tightening aggressively—albeit with significant regional divergence (chart 3). Financial markets, for their part, are not yet signalling a loss of inflation control, but the rise in real yields suggests increasing concern around the broader policy mix, particularly fiscal pressures (chart 4). Finally, the adjustment to the shock is unlikely to be uniform. Structural differences in domestic energy capacity are already driving wide divergences in electricity prices, leaving more import-dependent economies exposed to higher costs and sharper trade-offs between growth and inflation (charts 5 and 6). Taken together, the message is clear: even if geopolitical tensions ease, the economic aftershocks are likely to be uneven, persistent and increasingly shaped by structural constraints.
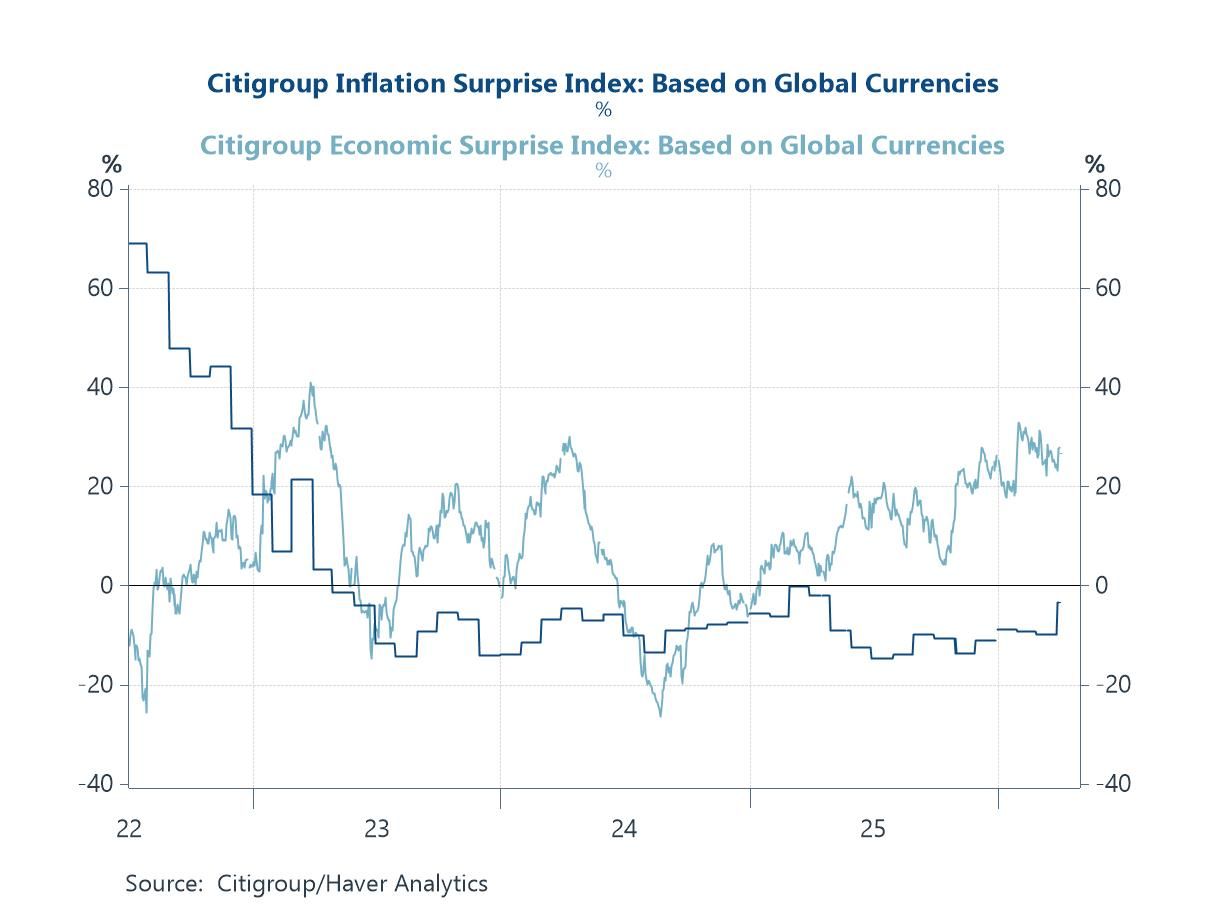
Positive Growth Surprises, Negative Inflation Surprises—For Now The global macro backdrop heading into the latest Middle East shock was, by recent standards, relatively constructive. As the chart shows, growth data had been consistently surprising to the upside, while inflation surprises have been in negative territory—an unusually benign combination suggesting resilient activity alongside easing price pressures. What is striking, however, is that—at least through March and into early April—this pattern has not yet been meaningfully dislodged. For now, the data flow still reflects a world that was stabilising rather than deteriorating. That said, this is almost certainly a lagging signal. Supply-side shocks of this nature—particularly those centred on energy—tend to work with a delay but can be highly disruptive once they feed through. The risk, therefore, is that the current “goldilocks” surprise dynamic proves short-lived as higher energy costs, supply chain frictions and rising uncertainty begin to reshape the incoming data in the weeks ahead.
Chart 1: Global Data Surprises: Positive Growth, Negative Inflation Combination Persisting
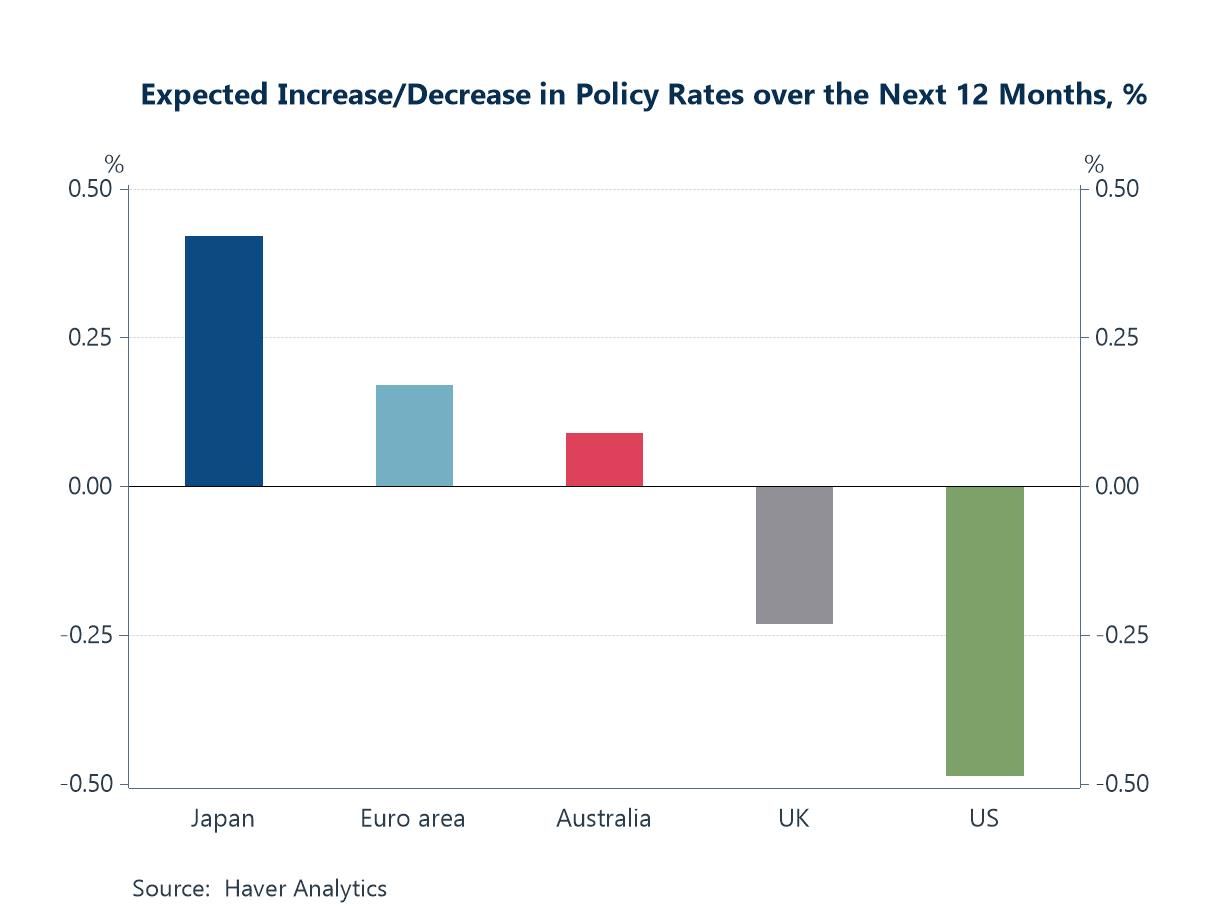
Monetary Policy Expectations Shift as Easing Bets Are Repriced How policymakers respond to the evolving situation in the Middle East will be critical in shaping both market dynamics and the broader global outlook. This chart, based on the latest April Blue Chip Financial Forecasts survey, suggests that expectations are already beginning to shift. Forecasters are now less inclined to anticipate policy easing in the period ahead—particularly in the euro area, where expectations for rate cuts have been scaled back. Similarly, some of the easing previously priced for the Federal Reserve and the Bank of England has been pared back over the next 12 months. While this is not yet a full pivot toward tightening, it does point to a more cautious policy backdrop, reflecting the risk that renewed energy-driven inflation pressures could constrain central banks’ ability to support growth.
Chart 2: Blue Chip Financial Forecasts Survey: Fewer Cuts Expected Across Major Central Banks
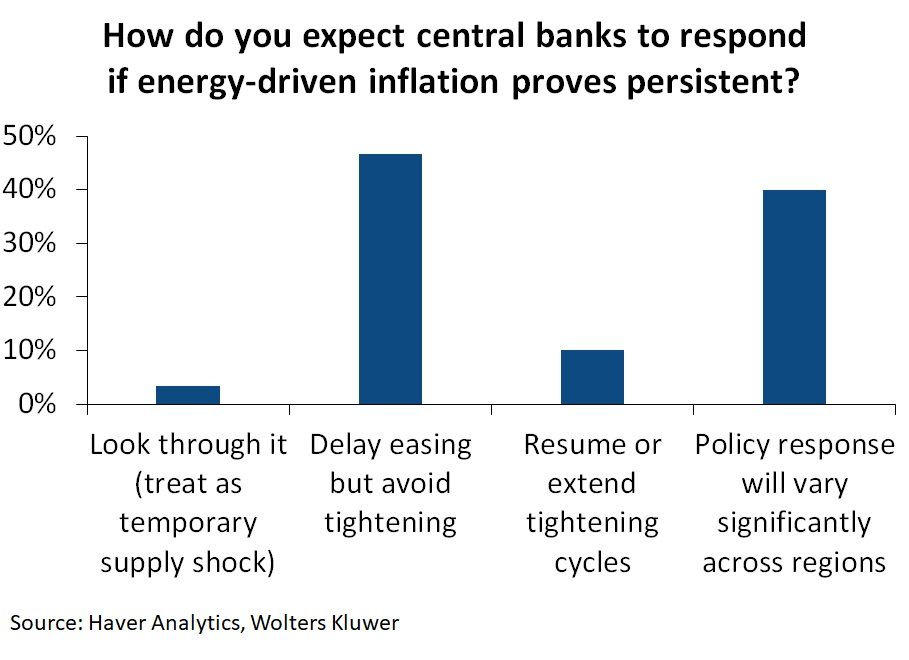
Delay, Don’t Tighten: Central Banks’ Likely Playbook If the previous chart highlights a shift in policy expectations, this one gives a clearer sense of the reaction function underpinning it. When asked how central banks would respond if energy-driven inflation proves more persistent, most panellists point not to renewed tightening, but to a more cautious delay in easing. In other words, the hurdle for rate cuts has risen, even if the bar for hikes remains relatively high. This distinction matters. It suggests that policymakers are likely to treat the shock as a supply-driven inflation impulse—one that complicates the outlook but does not automatically warrant aggressive tightening. At the same time, the responses underscore a second important theme: divergence. A sizeable share of forecasters expect policy paths to vary significantly across regions, reflecting differences in energy exposure, inflation dynamics and domestic growth conditions. Taken together, the message is one of constrained flexibility. Central banks may want to support growth, but persistent energy pressures could keep them on hold for longer than previously anticipated—reinforcing the more cautious policy outlook already evident in market pricing.
Chart 3: How Central Banks May Respond to Persistent Energy-Driven Inflation
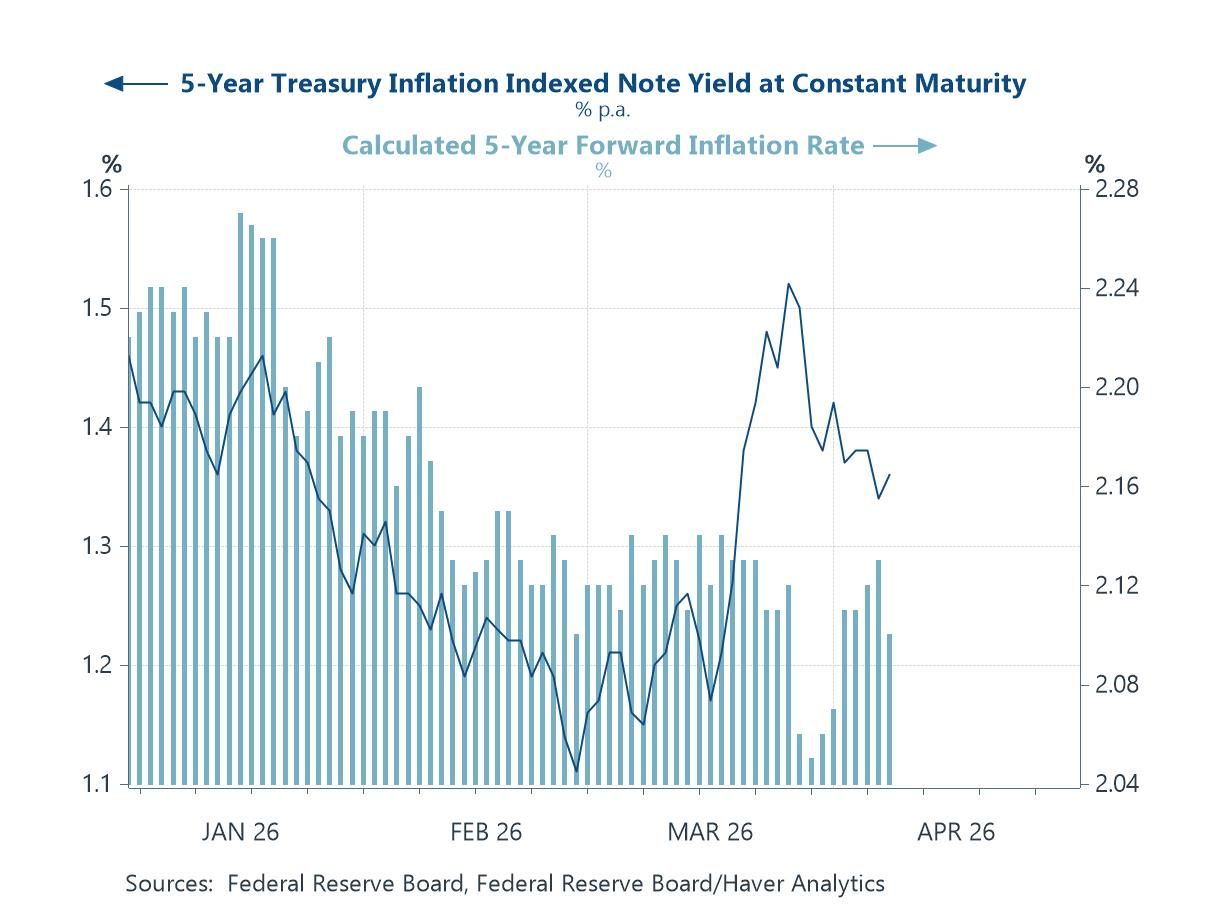
Markets Signal Fiscal Concern, Not Inflation Panic If central banks are likely to proceed cautiously, financial markets are already beginning to draw their own conclusions. This chart shows that the recent adjustment in US Treasury markets has been driven primarily by a rise in real yields rather than a meaningful increase in inflation expectations. In other words, markets are not yet pricing a loss of monetary policy credibility or a sharp unanchoring of inflation expectations. Instead, the move points more toward concerns around the broader policy mix—particularly the fiscal backdrop and the potential for increased borrowing needs in an environment of heightened geopolitical risk. This distinction is important. A rise in inflation expectations would suggest fears of central banks falling behind the curve. What we are seeing instead is a repricing of real rates, consistent with tighter financial conditions and a higher risk premium. For now, at least, markets appear to view the shock less as a classic inflation spiral and more as a development that complicates the growth outlook and places greater strain on policy frameworks—especially on the fiscal side.
Chart 4: Rising Real Yields Drive Market Adjustment, Not Inflation Expectations
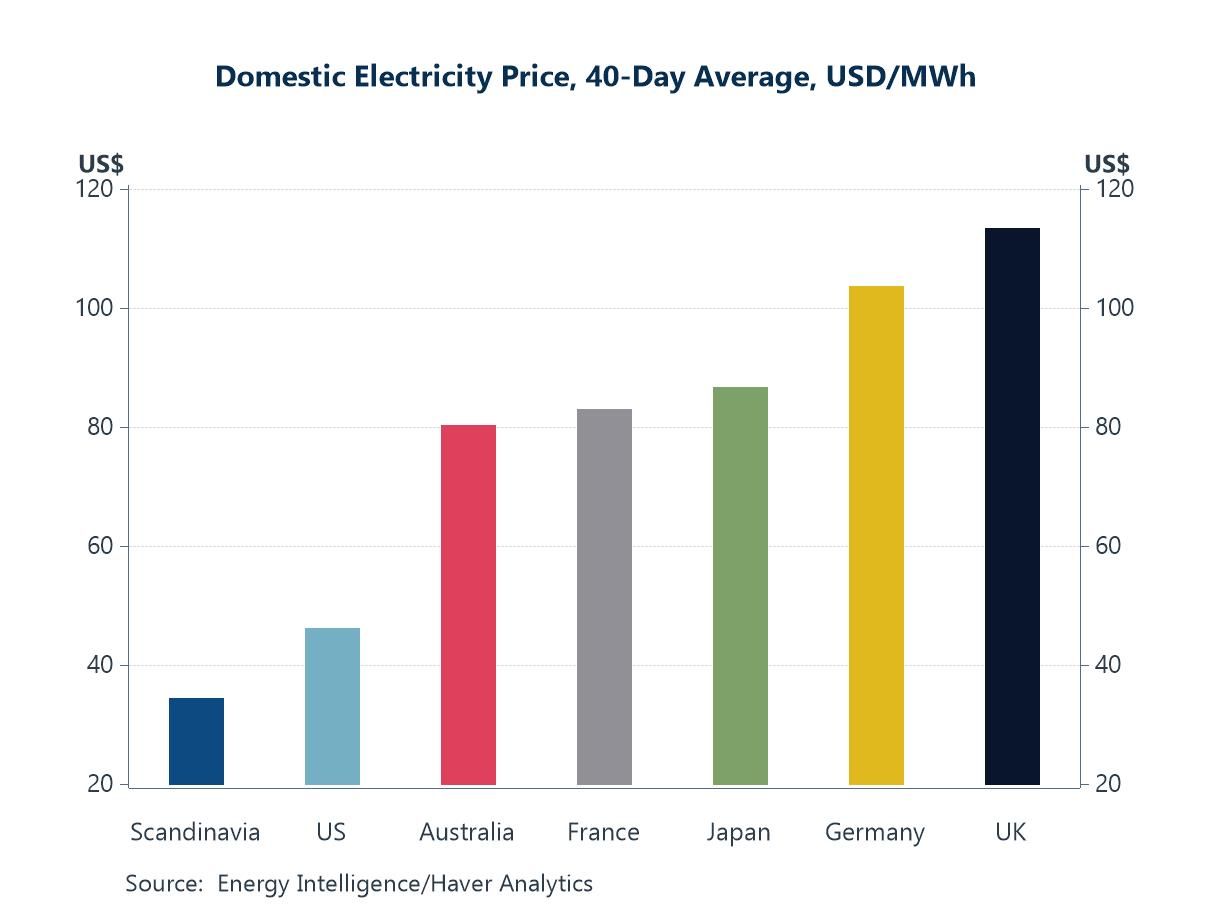
Electricity Prices Reflect Energy Dependence The initial response in electricity markets since the Middle East disruption has followed a familiar pattern. Economies with greater domestic energy capacity—such as Scandinavia and, to a lesser extent, the US—have seen relatively contained electricity prices. By contrast, those more reliant on imported energy—most notably the UK and parts of Europe—continue to face significantly higher costs
Chart 5: Electricity Prices Diverge Sharply Across Economies
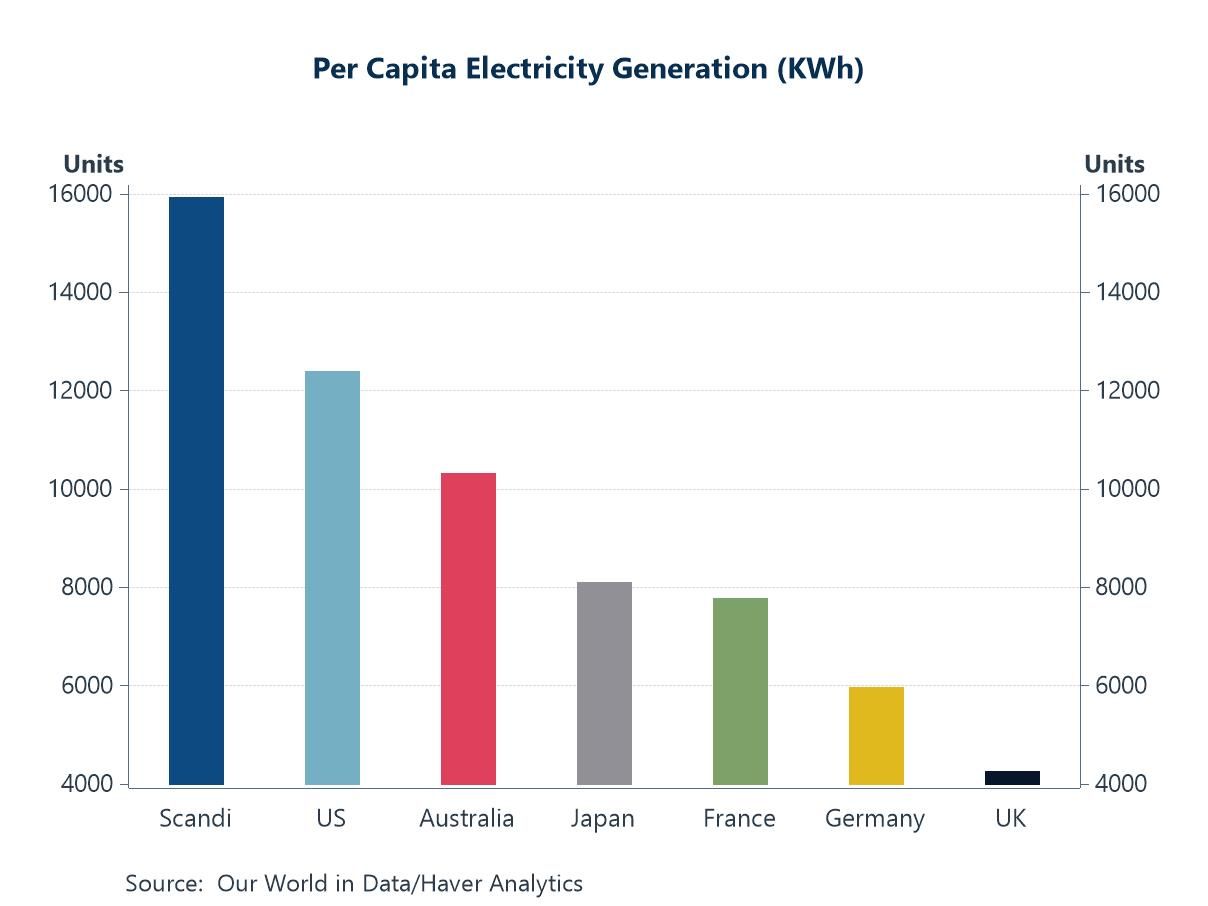
Generation Capacity Determines Energy Resilience These price dynamics are closely linked to underlying differences in electricity generation capacity. As the sixth chart shows, countries with higher per capita electricity production—again including Scandinavia and the US—are structurally better positioned to absorb external shocks. In contrast, economies with more limited domestic generation capacity, such as the UK and Germany, are inherently more exposed to fluctuations in global energy markets. This structural divide is likely to prove increasingly important in the period ahead, influencing not just near-term inflation outcomes but also the relative resilience of growth across economies as energy costs remain volatile.
Chart 6: Per Capita Electricity Generation Varies Widely Across Economies

Andrew Cates
AuthorMore in Author Profile »Andy Cates joined Haver Analytics as a Senior Economist in 2020. Andy has more than 25 years of experience forecasting the global economic outlook and in assessing the implications for policy settings and financial markets. He has held various senior positions in London in a number of Investment Banks including as Head of Developed Markets Economics at Nomura and as Chief Eurozone Economist at RBS. These followed a spell of 21 years as Senior International Economist at UBS, 5 of which were spent in Singapore. Prior to his time in financial services Andy was a UK economist at HM Treasury in London holding positions in the domestic forecasting and macroeconomic modelling units. He has a BA in Economics from the University of York and an MSc in Economics and Econometrics from the University of Southampton.
More Economy in Brief


