 Global| Jul 05 2005
U.S. Vehicle Sales Led Higher By Truck Rebound
by:Tom Moeller
|in:Economy in Brief
Summary
US sales of light vehicles in June recovered all of recent months' weakness and rose to the highest level in nearly four years, according to the Autodata Corporation. At 17.53M, sales rose 5.2% from May and rose 13.8% versus a [...]
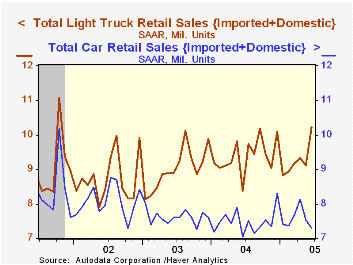
US sales of light vehicles in June recovered all of recent months' weakness and rose to the highest level in nearly four years, according to the Autodata Corporation. At 17.53M, sales rose 5.2% from May and rose 13.8% versus a depressed level one year ago.
Sales of light trucks surged 11.9% m/m to the highest level since 2001. The gain lifted the average level of truck sales so far this year 1.6% versus the first six months of 2004. Sales of US made trucks were notably strong, rising 13.2% m/m and 25.1% y/y. Domestics account for 88% of total light truck sales in the US.
Despite the drag on truck sales from higher gasoline prices, Bureau of Labor Statistics' data indicates that truck prices firmed this year through May versus deflation from 2002 to 2004. Gasoline prices rose to an average $2.22 per gallon (15.3% y/y) during the latest week.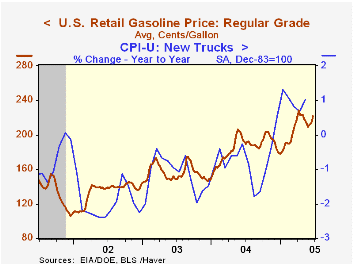
Car sales fell for the second consecutive month in June and for the fourth month this year. The 2.9% m/m decline left the average level of car sales 1.6% above last year.
Imports' share of the US market for new vehicles fell sharply to 19.6% in June versus 20.2 during the first five months of 2005.
| Light Vehicle Sales (SAAR, Mil. Units) | June | May | Y/Y | 2004 | 2003 | 2002 |
|---|---|---|---|---|---|---|
| Total | 17.53 | 16.67 | 13.8% | 16.88 | 16.63 | 16.81 |
| Autos | 7.31 | 7.53 | 3.9% | 7.49 | 7.62 | 8.07 |
| Trucks | 10.22 | 9.14 | 22.1% | 9.39 | 9.01 | 8.74 |
by Tom Moeller July 5, 2005
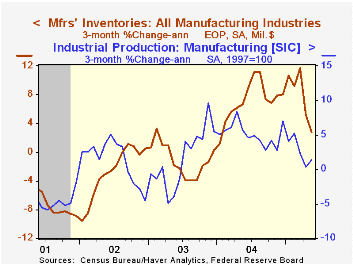
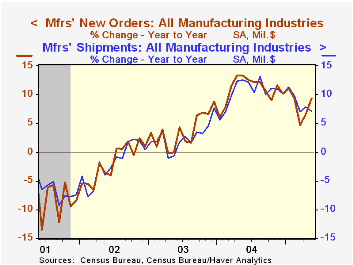
Factory inventories were unchanged in May following a downwardly revised slight decline in April. Three month growth in inventories fell to 2.7% (AR) from the peak rate of growth near 12% in March and that slowdown explains much of the slowdown in factory output growth.
Slower rates of inventory accumulation continue notable in the furniture industry where three month growth fell to 2.3% from versus the high of 28.4% and in the electrical equipment industry where growth in inventories fell to 6.0% with outright decumulation in May. The level of computer inventories has been declining this year with three month growth at -4.6% versus a peak of 13% last summer.
Factory shipments were roughly unchanged in May but three month growth improved to 9.2% due to rebounds in computers and heavy duty trucks.
Orders to the factory sector jumped 2.9% due to the unrevised 5.5% surge in durable goods orders.
Unfilled orders jumped 1.9% due to the 10.6% spike in unfilled orders for aircraft & parts. Less transportation altogether backlogs fell 0.1% (+7.6% y/y). The ratio of unfilled orders to shipments outside of transportation has moved sideways since early last year.
Trends in Hours, Balanced Growth and the Role of Technology in the Business Cycle from the Federal Reserve Bank of St. Louis is available here.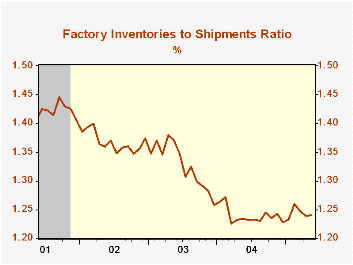
| Factory Survey (NAICS) | May | April | Y/Y | 2004 | 2003 | 2002 |
|---|---|---|---|---|---|---|
| Inventories | 0.0% | -0.0% | 7.7% | 7.5% | -1.3% | -1.8% |
| New Orders | 2.9% | 0.7% | 9.3% | 10.9% | 3.7% | -1.9% |
| Shipments | -0.0% | 0.7% | 7.2% | 10.5% | 2.6% | -2.0% |
| Unfilled Orders | 1.9% | -0.1% | 7.5% | 9.1% | 4.2% | -6.1% |
by Louise Curley July 5, 2005
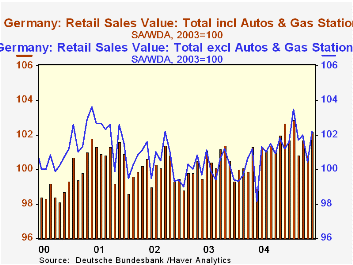
Retail sales provided another positive statistic for Germany in May. The volume of retail sales was up 1.2% in May on a seasonally adjusted basis from April and the value was up 1.8%. On a seasonally unadjusted basis, the volume of retail sales was 2.7% over May 2004 and the value was 3.2% over the same period.
The recently revised series for German retail sales shows a somewhat better picture over the past few years than that previously reported. For example the new data show that retail sales increased 1.2% in 2004 instead of declining 1.7% as reported earlier. For 2003 the difference was much smaller--a decline of 0.5% vs. one of 0.6% reported earlier.
The headline series excludes automobiles and gas stations and is shown seasonally adjusted and unadjusted for values and volumes. Data on automobiles and gas stations are released some weeks after the retail sales release. However, a memo item is included in the current release that shows total retail sales including estimated automobiles and gas stations on a seasonally adjusted bases in value and volume terms. The two value series are shown in the attached chart. It may seem strange that the total excluding automobiles and gas stations is at times higher than the total including these items. But these data are index numbers relative to the year 2003, not absolute levels. Except for the items just noted most of the data are not seasonally adjusted. .
| German Retail Sales ex Automobiles and Gas Stations | May 05 | Apr 05 | May 04 | M/M% | Y/Y% | 2004 | 2003 | 2002 |
|---|---|---|---|---|---|---|---|---|
| Value (2003=100) | ||||||||
| Not seasonally adjusted | 98.8 | 103.4 | 95.8 | -4.45 | 3.13 | 101.4 | 100.0 | 100.5 |
| Seasonally adjusted | 102.2 | 100.4 | 98.1 | 1.79 | 4.18 | 100.7 | 100.1 | 100.5 |
| SA Value incl autos & gas stations | 102.2 | 100.8 | 98.9 | 1.39 | 3.34 | 101.0 | 100.2 | 99.5 |
| Volume 2000 Prices (2003=100) | ||||||||
| Not seasonally adjusted | 98.0 | 102.7 | 95.4 | 94.58 | 2.73 | 101.2 | 100.0 | 100.5 |
| Seasonally adjusted | 101.3 | 100.1 | 98.0 | 1.20 | 3.37 | 100.7 | 100.1 | 100.5 |
| SA Value incl autos & gas stations | 100.9 | 100.0 | 98.3 | 0.90 | 2.64 | 100.6 | 100.2 | 100.2 |

Tom Moeller
AuthorMore in Author Profile »Prior to joining Haver Analytics in 2000, Mr. Moeller worked as the Economist at Chancellor Capital Management from 1985 to 1999. There, he developed comprehensive economic forecasts and interpreted economic data for equity and fixed income portfolio managers. Also at Chancellor, Mr. Moeller worked as an equity analyst and was responsible for researching and rating companies in the economically sensitive automobile and housing industries for investment in Chancellor’s equity portfolio. Prior to joining Chancellor, Mr. Moeller was an Economist at Citibank from 1979 to 1984. He also analyzed pricing behavior in the metals industry for the Council on Wage and Price Stability in Washington, D.C. In 1999, Mr. Moeller received the award for most accurate forecast from the Forecasters' Club of New York. From 1990 to 1992 he was President of the New York Association for Business Economists. Mr. Moeller earned an M.B.A. in Finance from Fordham University, where he graduated in 1987. He holds a Bachelor of Arts in Economics from George Washington University.
More Economy in Brief


