U.S. Industrial Production Jumped in April
by:Sandy Batten
|in:Economy in Brief
Summary
- Total industrial output increased a much larger-than-expected 0.7% m/m in April with a small upward revision to March.
- Manufacturing output increased 0.6% m/m, led by a 5.3% m/m rebound in vehicle production.
- Mining output edged down 0.1% m/m, while utilities production rose 1.9% m/m.
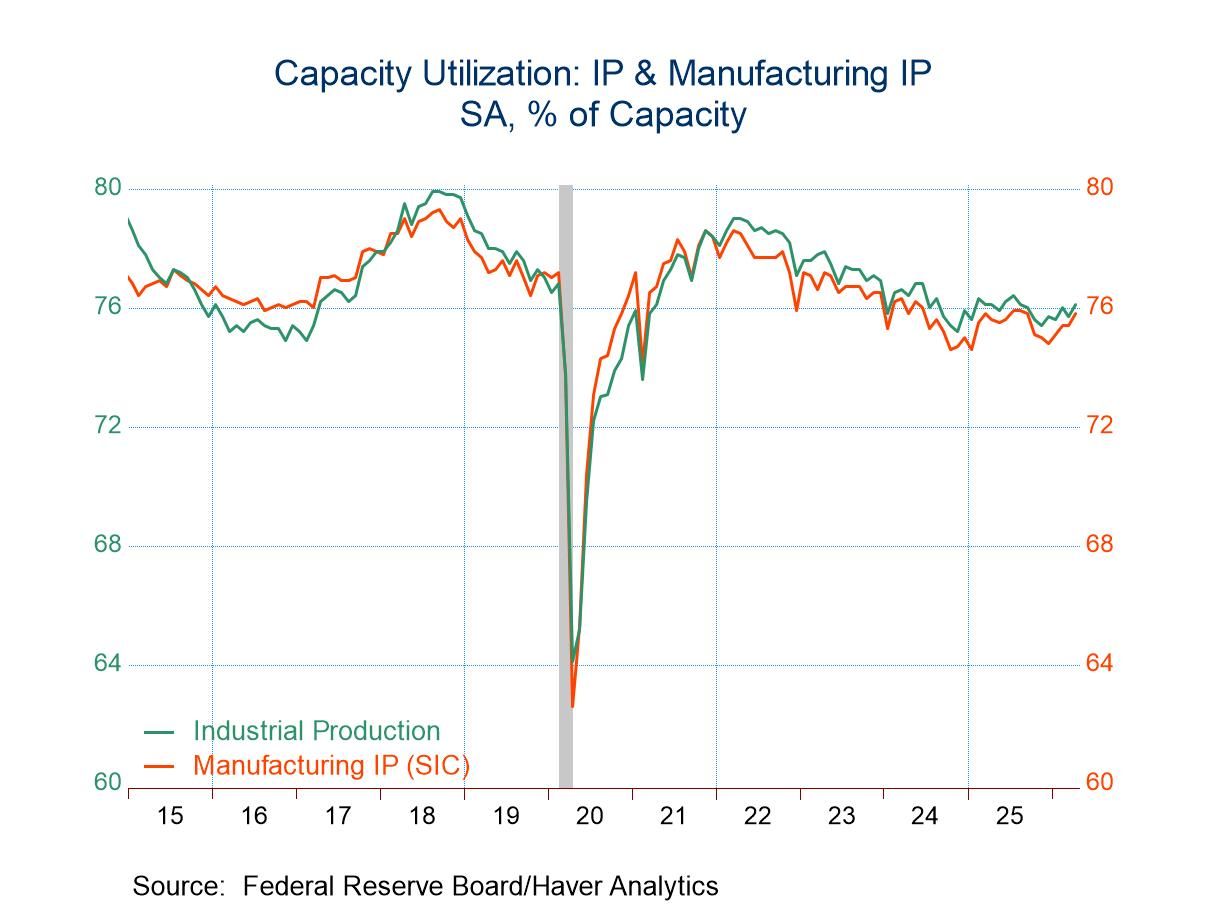
- The headline rate of capacity utilization rose to 76.1% in April, its highest reading since last August but still well below its long-term average.
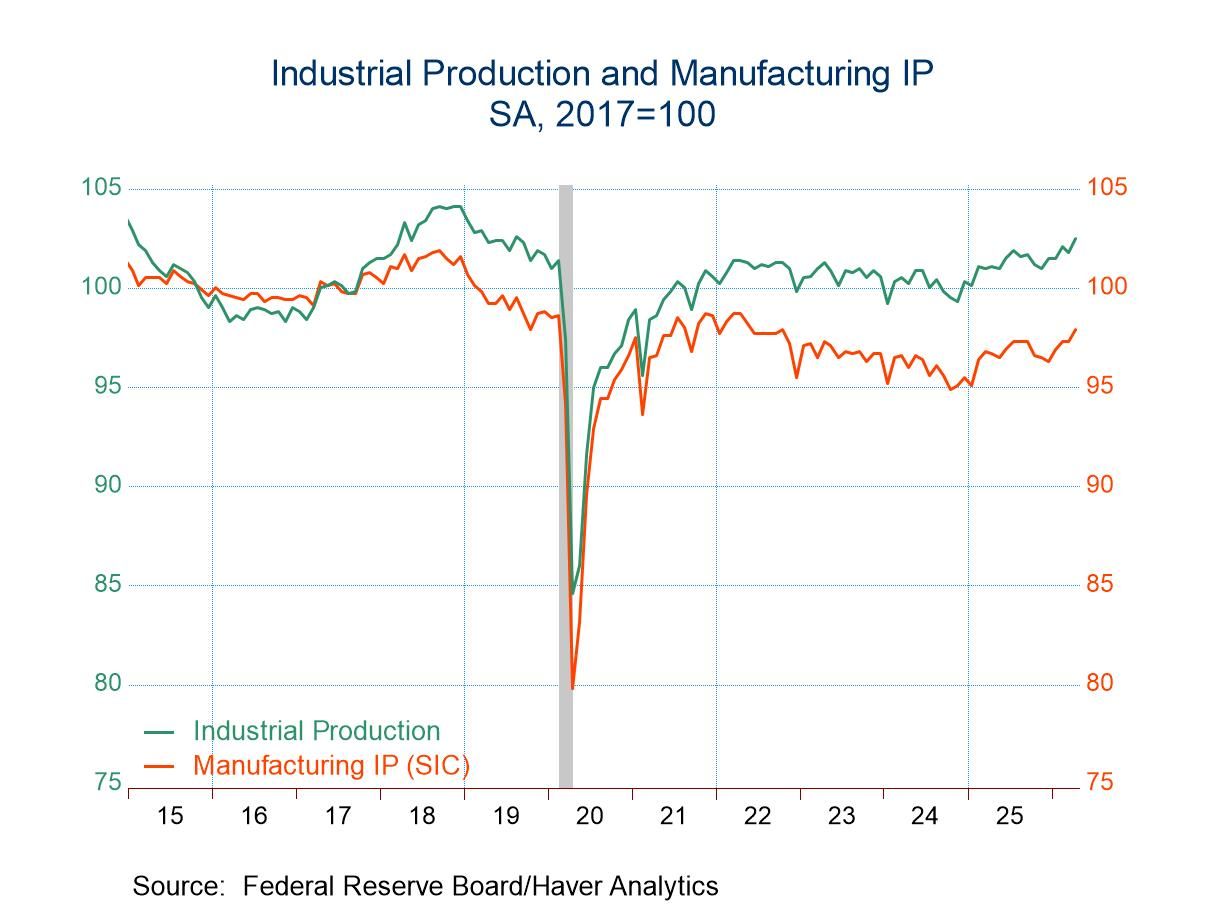
Industrial production (IP) rose a much larger-than-expected 0.7% m/m in April, rebounding from an upwardly revised 0.3% m/m decline in March (previously -0.5% m/m), according to data released by the Federal Reserve Board. The Action Economics Survey looked for a 0.2% monthly gain. The y/y rate also rebounded in April, rising to 1.4% y/y after having fallen to 0.7% in March. IP has clearly trended up since late last year. Since November 2025, it has grown at a 3.6% annual rate. The current level of output is the highest since August 2019 but is still 1.5% below the November 2018 series peak.
Manufacturing output led the April rebound, rising 0.6% m/m (1.3% y/y) following an upwardly revised 0.1% monthly increase in March (previously -0.1% m/m). Mining output fell in April for the second consecutive month, edging down 0.1% m/m (+0.2% y/y) after a 1.6% monthly drop in March (revised down from -1.2% m/m). Utilities production rebounded in April, jumping 1.6% m/m (2.7% y/y) and more than offsetting a 1.4% monthly decline in March (revised up from -2.3% previously). The rebound in utilities output reflected a 1.1% rise in electricity production and a 7.3% monthly jump in natural gas distribution, the first monthly gain in four months.
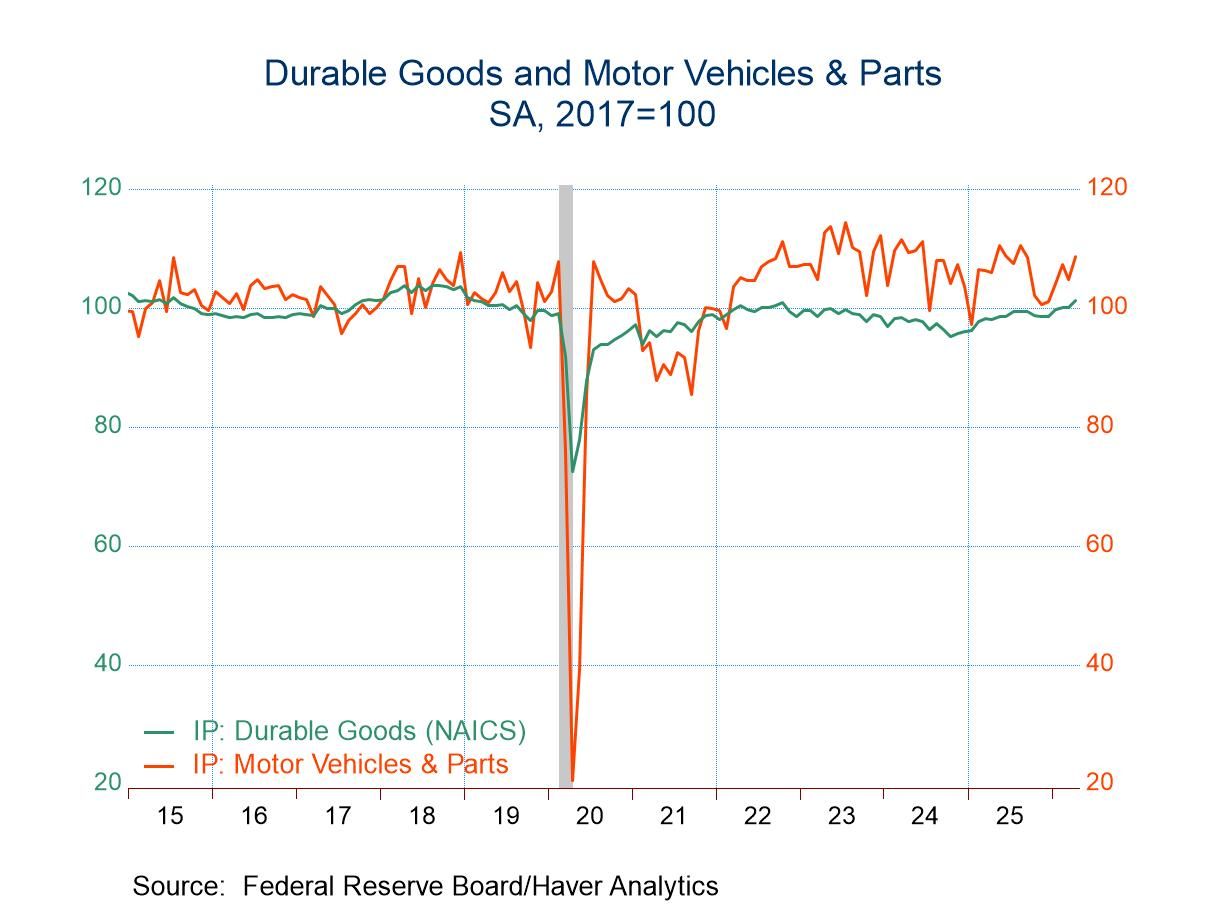
Within manufacturing, durable goods production jumped 1.2% m/m (3.2% y/y) in April after having been unchanged in March. A 3.7% m/m rebound in motor vehicles and parts production, the largest monthly gain since May 2025, led the April increase. Motor vehicles and parts production had fallen 2.4% m/m in March. Production of computers and electronic products increased 1.5% m/m, the fourth consecutive monthly rise. Aerospace output rose 1.6% m/m in April, the third consecutive monthly gain and the largest since July 2025. By contrast, furniture production fell 1.8% m/m, the third consecutive monthly decline.
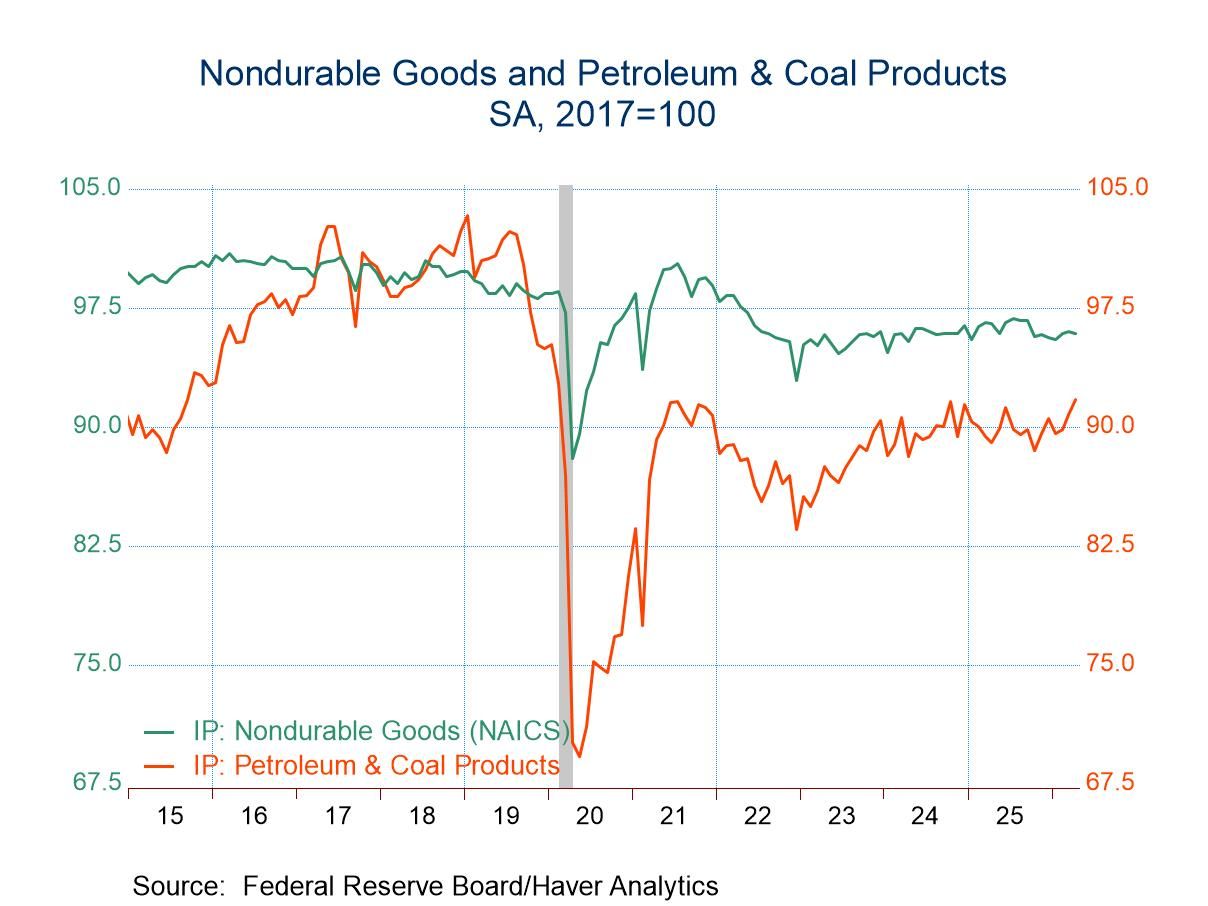
Output of nondurable manufactured goods edged down 0.1% m/m (-0.6% y/y) in April, the first monthly decline in four months. Production of apparel and leather goods slumped 2.2% m/m on top of a 2.0% monthly fall in March. Chemical output fell 0.9% m/m in April, its first monthly decline in four months. Output of plastics and rubber products fell 0.9% m/m, the first monthly fall in four months. By contrast, production of petroleum and coal products rose 1.0% m/m in April, the same monthly increase as in March.
By market group, output of consumer goods rebounded in April, increasing 0.9% m/m (-0.2% y/y) following a 0.8% m/m decline in March. Production of business equipment surged 1.5% m/m (+6.0% y/y) in April, the largest monthly gain since March 2025. Output of construction supplies was unchanged in April from March (+1.2% y/y) following a 0.9% m/m gain in March. Materials production rebounded in April, rising 0.5% m/m (1.2% y/y) after a 0.4% m/m decline in March.
In special classifications, output of selected high-tech industries increased 1.0% m/m (+9.2% y/y) in April following a 0.5% monthly gain in March. The rebound in motor vehicles and parts production reflected a 5.3% monthly surge in vehicle output, the largest monthly gain since May 2025. Manufacturing output excluding selected high-tech industries rose 0.6% m/m in April, the largest increase since February 2025, following a 0.1% m/m increase in March. Manufacturing output excluding both selected high-tech industries and motor vehicles and parts advanced 0.3% m/m in April, the same monthly gain as in March.
Capacity utilization rose to 76.1% in April from 75.7% in March. The April reading was the highest since last August but was still 3.3%-points below its long-term (1972-2025) average. Manufacturing capacity utilization increased to 75.8% in April from 75.4% in March, 2.4%-points below its long-term average.
Industrial production and capacity data are in Haver’s USECON database. Additional detail on production and capacity utilization can be found in the IP database. The expectations figures come from the AS1REPNA database.

Sandy Batten
AuthorMore in Author Profile »Sandy Batten has more than 30 years of experience analyzing industrial economies and financial markets and a wide range of experience across the financial services sector, government, and academia. Before joining Haver Analytics, Sandy was a Vice President and Senior Economist at Citibank; Senior Credit Market Analyst at CDC Investment Management, Managing Director at Bear Stearns, and Executive Director at JPMorgan. In 2008, Sandy was named the most accurate US forecaster by the National Association for Business Economics. He is a member of the New York Forecasters Club, NABE, and the American Economic Association. Prior to his time in the financial services sector, Sandy was a Research Officer at the Federal Reserve Bank of St. Louis, Senior Staff Economist on the President’s Council of Economic Advisors, Deputy Assistant Secretary for Economic Policy at the US Treasury, and Economist at the International Monetary Fund. Sandy has taught economics at St. Louis University, Denison University, and Muskingun College. He has published numerous peer-reviewed articles in a wide range of academic publications. He has a B.A. in economics from the University of Richmond and a M.A. and Ph.D. in economics from The Ohio State University.
More Economy in Brief


 Asia
Asia
