 Global| May 14 2026
Charts of the Week: The Tug of War
by:Andrew Cates
|in:Economy in Brief
Summary
The global economy is still caught between two powerful and competing forces. On one side, the AI investment boom continues to support growth, industrial activity and equity markets, particularly in the US and parts of Asia. On the other, renewed Middle East tensions and higher energy prices are adding to inflation risks and broader policy uncertainty. The latest Blue Chip survey reflects this divide clearly: growth expectations have generally held up best in economies tied to AI-related investment and technology supply chains, while inflation forecasts have risen more sharply in more energy-exposed economies such as the UK and euro area (chart 1). Forecasters still largely expect only limited pass-through from higher energy prices into core inflation, although recent US CPI data suggest underlying price pressures remain somewhat sticky (charts 2 and 3). At the same time, the extraordinary continued surge in global AI investment — now approaching $300 billion annually — highlights the sheer scale of capital being deployed into semiconductors, data centres and digital infrastructure, particularly in the United States (chart 4). The divergence in industrial production trends also reinforces the growing gap between economies benefiting from structural growth drivers — such as Taiwan’s semiconductor sector and Denmark’s pharmaceutical industry — and those struggling with higher energy costs and weaker competitiveness, notably Germany and the UK (chart 5). Meanwhile, improving Chinese activity indicators suggest policy support and stronger technology demand may finally be helping to stabilise growth (chart 6). Overall, the world economy remains resilient, but increasingly uneven, with AI-related investment continuing to offset — though not eliminate — the drag from geopolitical fragmentation and rising energy insecurity.
A Tug of War Between AI Hope and Geopolitical Shock The latest Blue Chip Economic Indicators survey highlights a growing divergence between economies benefiting from AI-driven optimism and those more exposed to the inflationary consequences of renewed geopolitical instability. Taiwan stands out as the clearest AI beneficiary, with growth forecasts revised sharply higher while inflation expectations have risen only modestly, reflecting surging semiconductor demand and continued investment in global technology supply chains. China also remains relatively resilient, supported by ongoing AI-related capital spending and stronger technology sectors. By contrast, the euro area and UK have seen much larger upward revisions to inflation forecasts alongside weaker or declining growth expectations, underscoring their greater vulnerability to the recent Middle East shock and higher energy costs. Korea sits somewhere in between: benefiting from the AI hardware cycle but still exposed to trade and energy headwinds. Overall, the chart illustrates the increasingly important push-and-pull shaping the global outlook: AI optimism and productivity hopes on one side, and geopolitical fragmentation, energy insecurity and supply-side inflation pressures on the other.
Chart 1: AI Optimism Meets Energy Anxiety

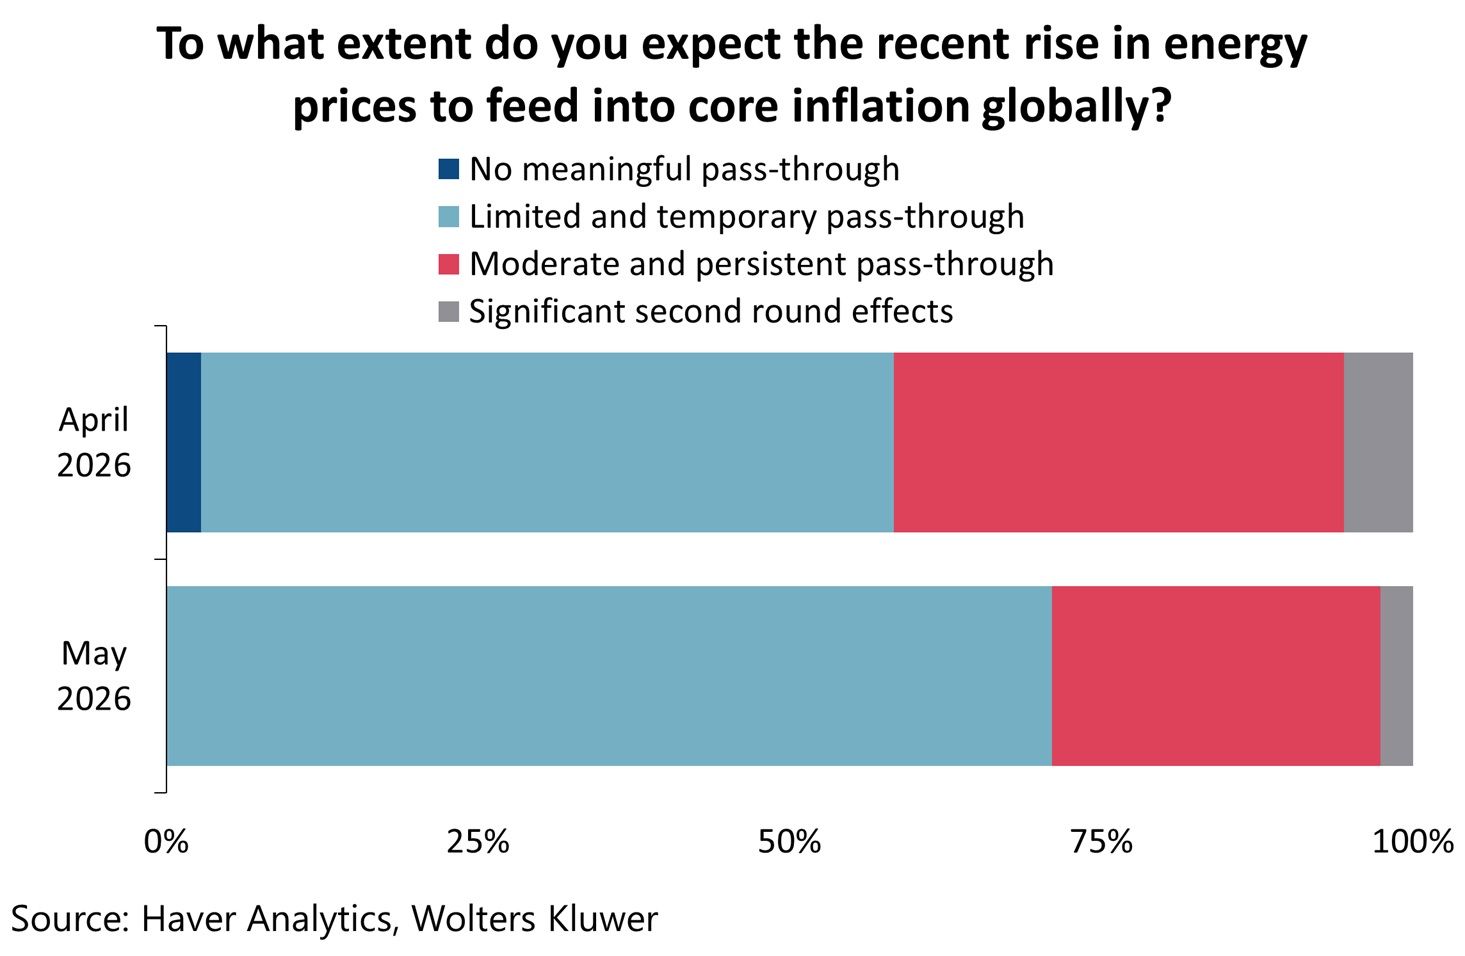
Forecasters See Contained Pass-Through Against this backdrop, our latest Blue Chip special question sought to gauge whether economists believe the recent rise in energy prices will remain largely contained — or whether it risks spilling more meaningfully into underlying global inflation dynamics. The results suggest forecasters have become somewhat less concerned about a broad and persistent inflationary impulse since April. A larger share of respondents in the May survey now expect only a “limited and temporary” pass-through into core inflation, while the proportion anticipating “moderate and persistent” effects has declined noticeably. Very few panelists expect significant second-round effects, implying that most still believe inflation expectations and wage-setting behaviour remain relatively well anchored. In part, this reflects confidence in central bank credibility and the view that softer global demand conditions will constrain firms’ pricing power. Yet the persistence of a sizeable minority still expecting moderate pass-through underscores the uncomfortable tension facing policymakers.
Chart 2: Inflation Fears Ease A Little But They Have Not Disappeared
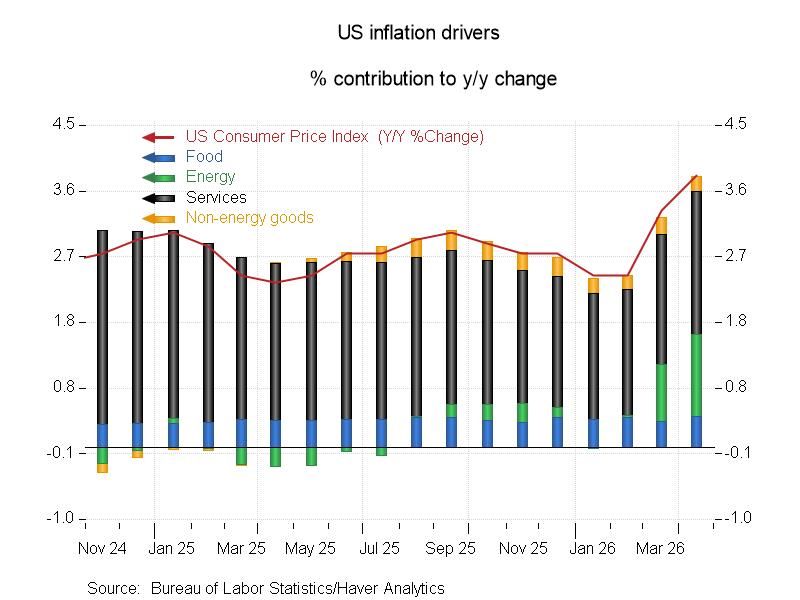
Energy Reawakens as a US Inflation Driver While survey respondents generally expect only limited pass-through from higher energy prices into broader inflation, the latest US CPI data provide a reminder that the process may already be underway at the margin. April’s CPI report showed core inflation coming in slightly firmer than expected, suggesting underlying price pressures remain more persistent than many policymakers had hoped. The decomposition of CPI inflation highlights that services continue to dominate overall inflation dynamics, reflecting still-elevated wage and labour-intensive price pressures across the economy. However, the more notable recent development has been the renewed contribution from energy prices, which had previously acted as a disinflationary force through much of 2025. Food inflation has also remained comparatively steady, while non-energy goods prices continue to exert only modest upward pressure despite ongoing tariff and supply-chain concerns. Taken together, the data reinforce the idea that the US economy is not facing a classic demand collapse, but rather a more uncomfortable supply-side environment in which geopolitical energy shocks risk colliding with still-resilient domestic demand, AI-related investment spending and sticky service-sector inflation.
Chart 3: US CPI Inflation Drivers: Energy Pressures Re-emerge
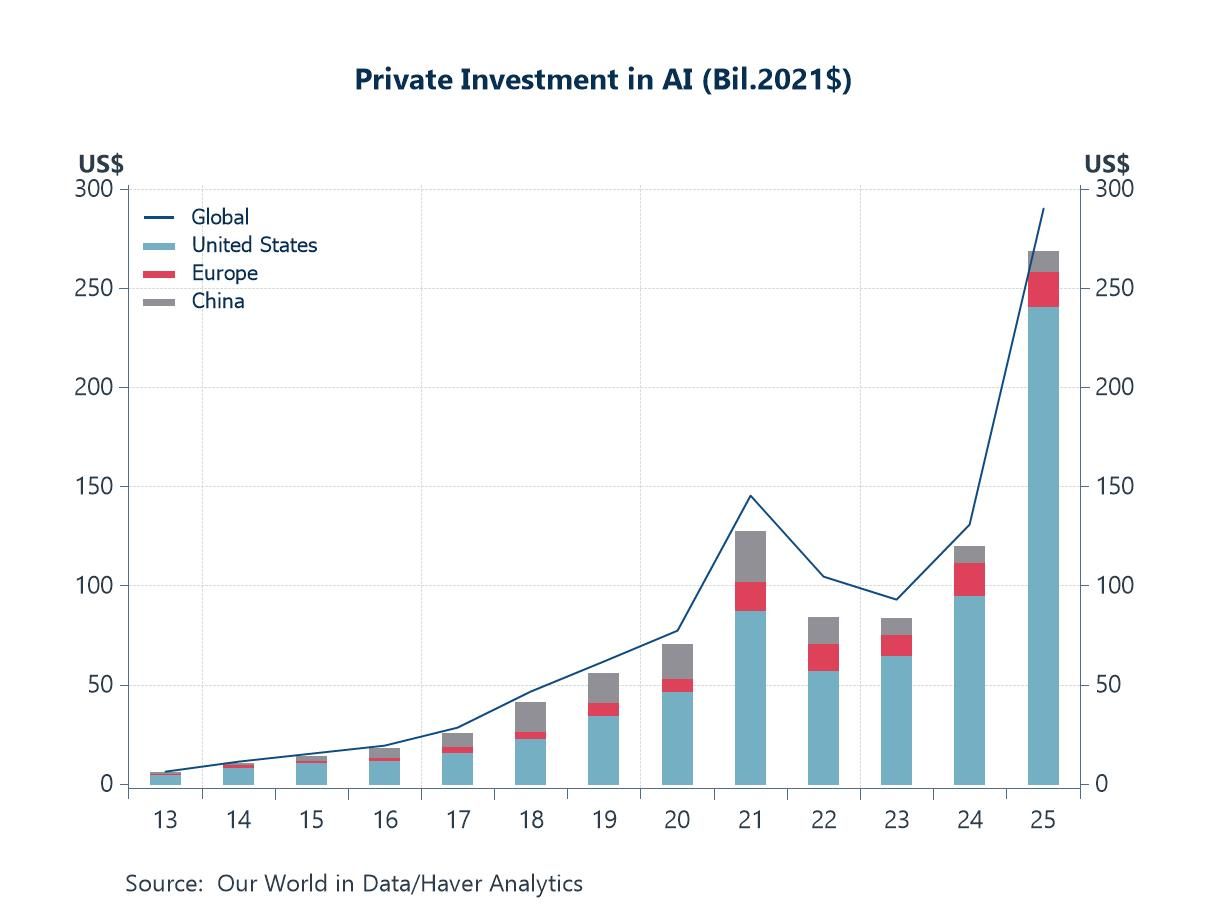
AI: The Powerful Counterweight to Geopolitical Headwinds If rising energy prices and geopolitical instability represent one major force shaping the current macroeconomic outlook, the extraordinary surge in AI-related investment represents the other. The latest data from Our World in Data show global private investment in AI accelerating sharply again in 2025, reaching close to $300 billion — more than double the level seen just two years earlier. The United States continues to dominate the global AI landscape, accounting for the overwhelming majority of private investment spending, while China and Europe remain considerably smaller contributors despite continued growth. The scale and speed of the 2025 increase is particularly striking given the broader backdrop of elevated policy uncertainty, trade fragmentation and concerns about slowing global productivity growth. In effect, the global economy is now being pulled in two competing directions: on one side, geopolitical tensions, supply-chain fragilities and more recent energy shocks are weighing on confidence and raising supply-side costs; on the other, AI enthusiasm is driving an enormous wave of capital expenditure, infrastructure build-out and technology-related demand. This helps explain why growth expectations — particularly in the US and parts of Asia — have remained comparatively resilient despite an increasingly uncertain global environment.
Chart 4: The AI Capex Supercycle Accelerates
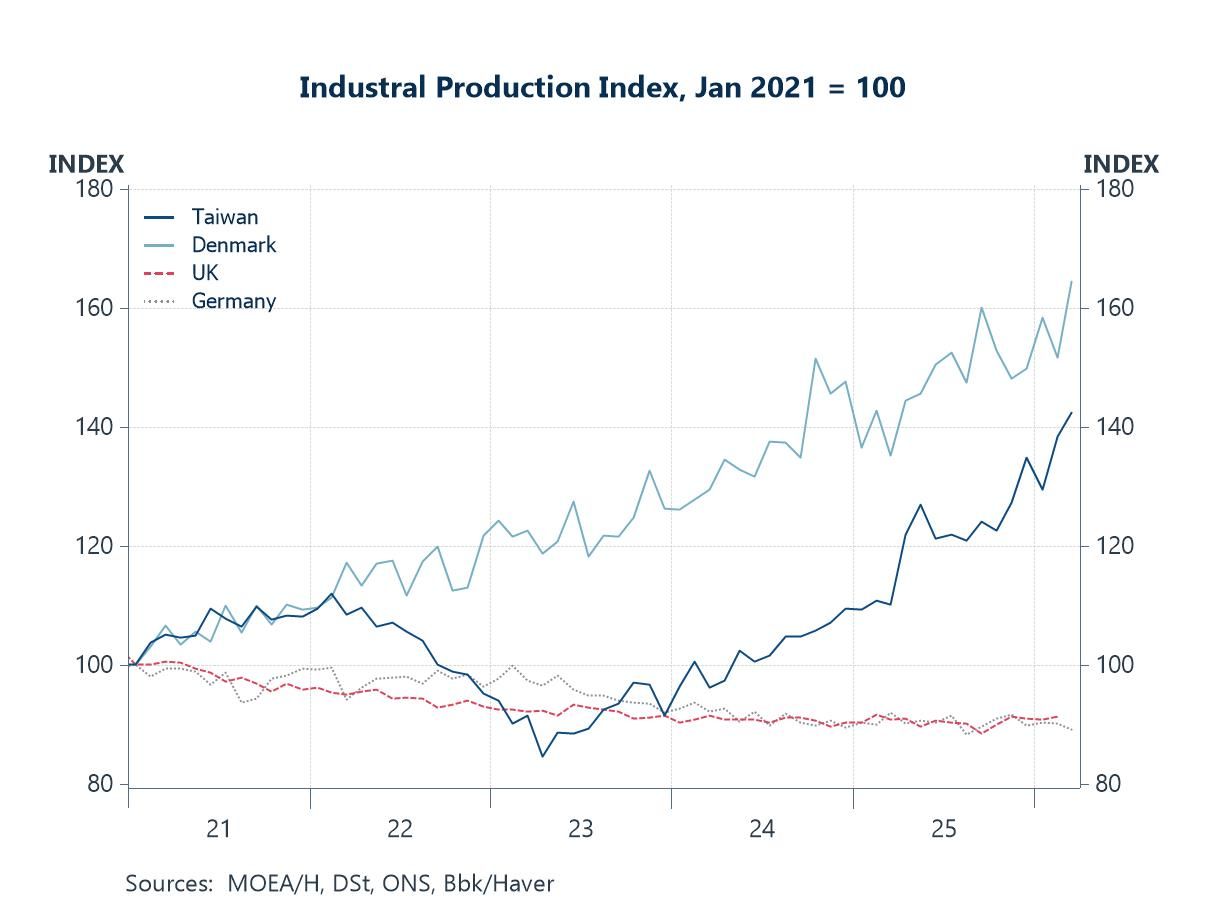
Industrial Winners and Losers in a Fragmenting Global Economy The divergence in industrial performance across advanced economies has become increasingly striking. Taiwan has emerged as one of the clearest beneficiaries of the global AI boom, with industrial production surging as semiconductor demand, data-centre investment and advanced electronics exports continue to accelerate. Denmark has also significantly outperformed, though for very different reasons, with the extraordinary global success of its pharmaceutical sector — particularly weight-loss and diabetes drugs — driving a powerful expansion in manufacturing output. By contrast, the UK and Germany have experienced a far weaker industrial recovery. In both cases, elevated energy costs and greater dependence on imported energy have weighed heavily on industrial competitiveness since the post-pandemic energy shock. Germany’s large manufacturing sector has been particularly exposed to higher natural gas prices and weaker external demand, while the UK has continued to struggle with a combination of high energy costs, weak productivity growth and subdued business investment. The chart highlights an increasingly important feature of the global economy: countries exposed to powerful structural growth themes such as AI or pharmaceuticals are pulling away from those still burdened by energy dependence and deteriorating industrial competitiveness.
Chart 5: The Good, the Great and the Energy-Exposed
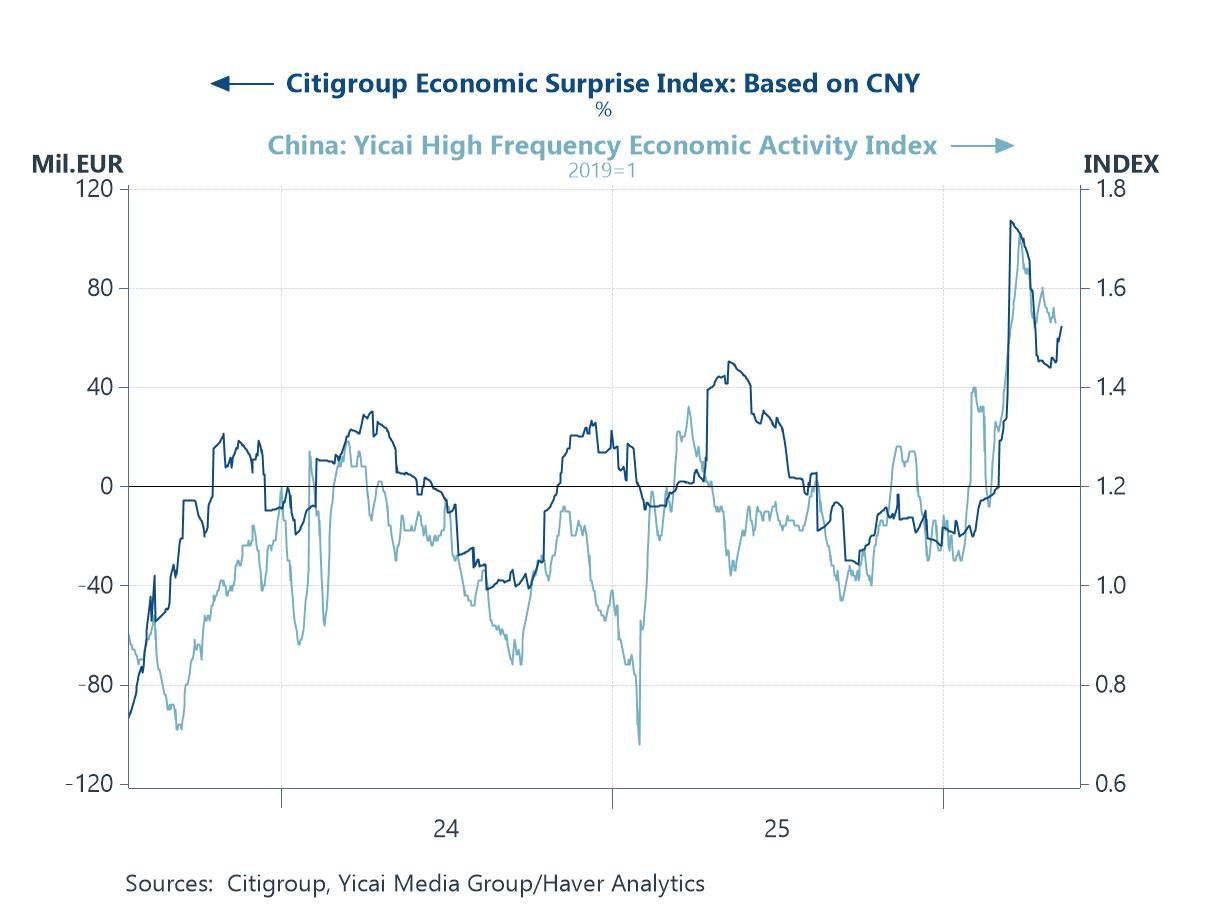
China’s Pulse Is Picking Up Again China’s economic backdrop has shown clearer signs of improvement in recent months, with both the Citigroup Economic Surprise Index and the Yicai High Frequency Economic Activity Index moving higher. The rebound suggests that incoming data have begun consistently outperforming expectations after a prolonged period of disappointment. Part of the recent improvement likely reflects the cumulative effects of policy easing, including targeted fiscal support, infrastructure spending and further efforts to stabilise the property sector. Export demand has also remained more resilient than many expected, helped in part by the continued strength of global technology and AI-related supply chains. At the same time, improving domestic mobility and energy usage indicators point to firmer underlying activity momentum. The Yicai index itself is designed to provide a near real-time pulse of the Chinese economy using a basket of high-frequency indicators including subway usage, air pollution, coal consumption, freight activity, unemployment and bankruptcy trends. While China still faces significant structural headwinds — including weak household confidence, property-sector fragilities and deflationary pressures — the recent pickup suggests that growth momentum may be stabilising at a time when several other major economies are becoming more vulnerable to geopolitical and energy-related shocks.
Chart 6: Improving Activity Data From China

Andrew Cates
AuthorMore in Author Profile »Andy Cates joined Haver Analytics as a Senior Economist in 2020. Andy has more than 25 years of experience forecasting the global economic outlook and in assessing the implications for policy settings and financial markets. He has held various senior positions in London in a number of Investment Banks including as Head of Developed Markets Economics at Nomura and as Chief Eurozone Economist at RBS. These followed a spell of 21 years as Senior International Economist at UBS, 5 of which were spent in Singapore. Prior to his time in financial services Andy was a UK economist at HM Treasury in London holding positions in the domestic forecasting and macroeconomic modelling units. He has a BA in Economics from the University of York and an MSc in Economics and Econometrics from the University of Southampton.
More Economy in Brief


