April PPI: Broad-Based Pressure
Summary
- The energy component led the sharp increase in the PPI, but it had support from many other areas.
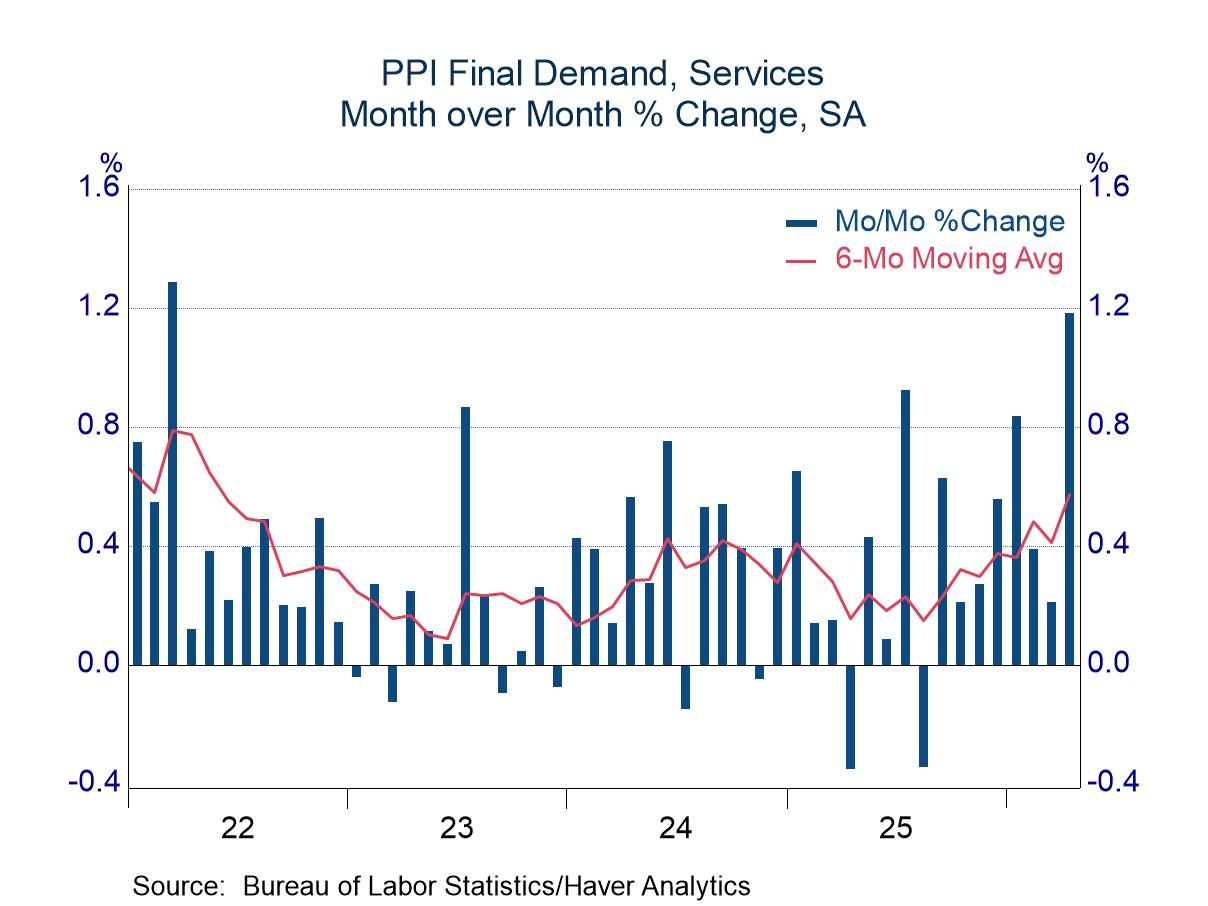
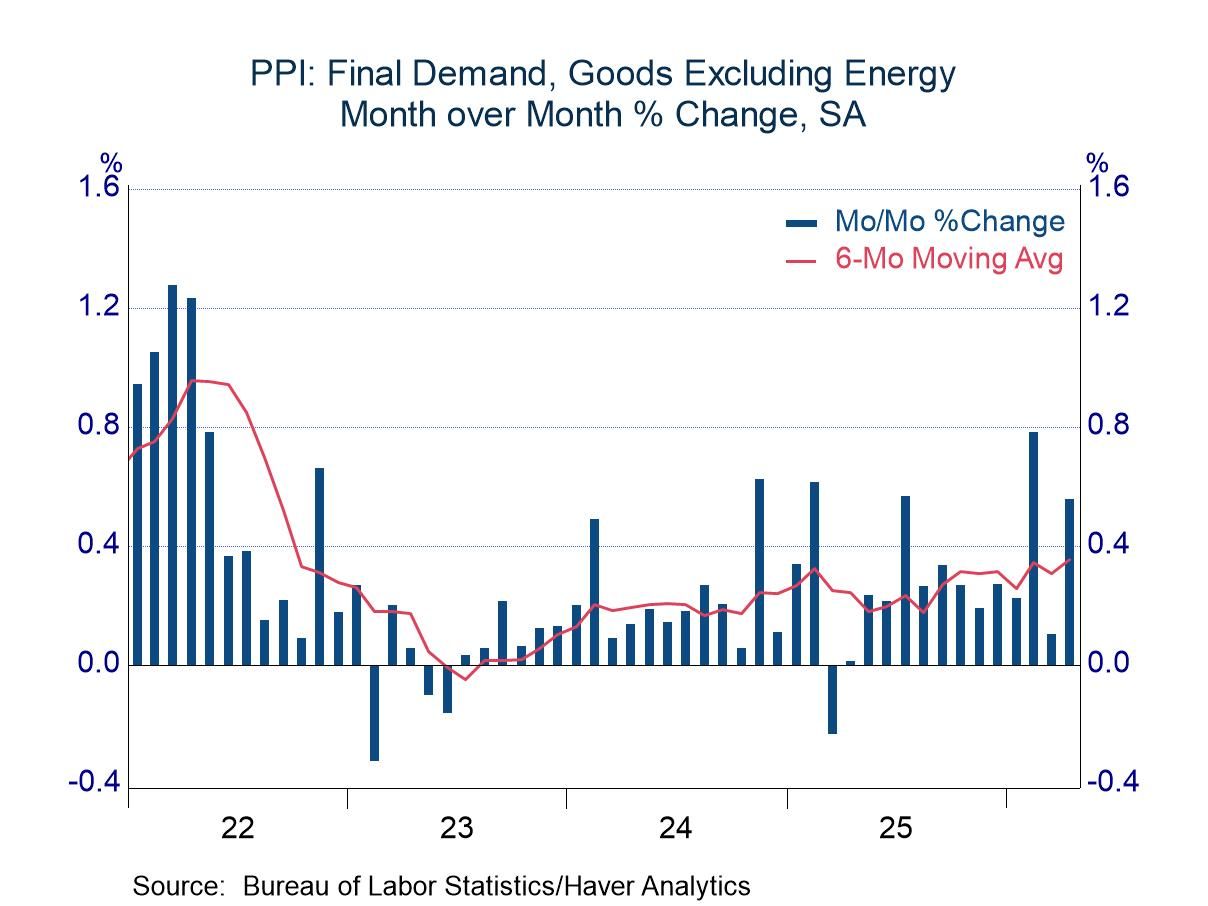
- Excluding energy, most service prices rose sharply; prices of non-energy goods also were under pressure.
- The food component went against the grain with an increase of only 0.2%.
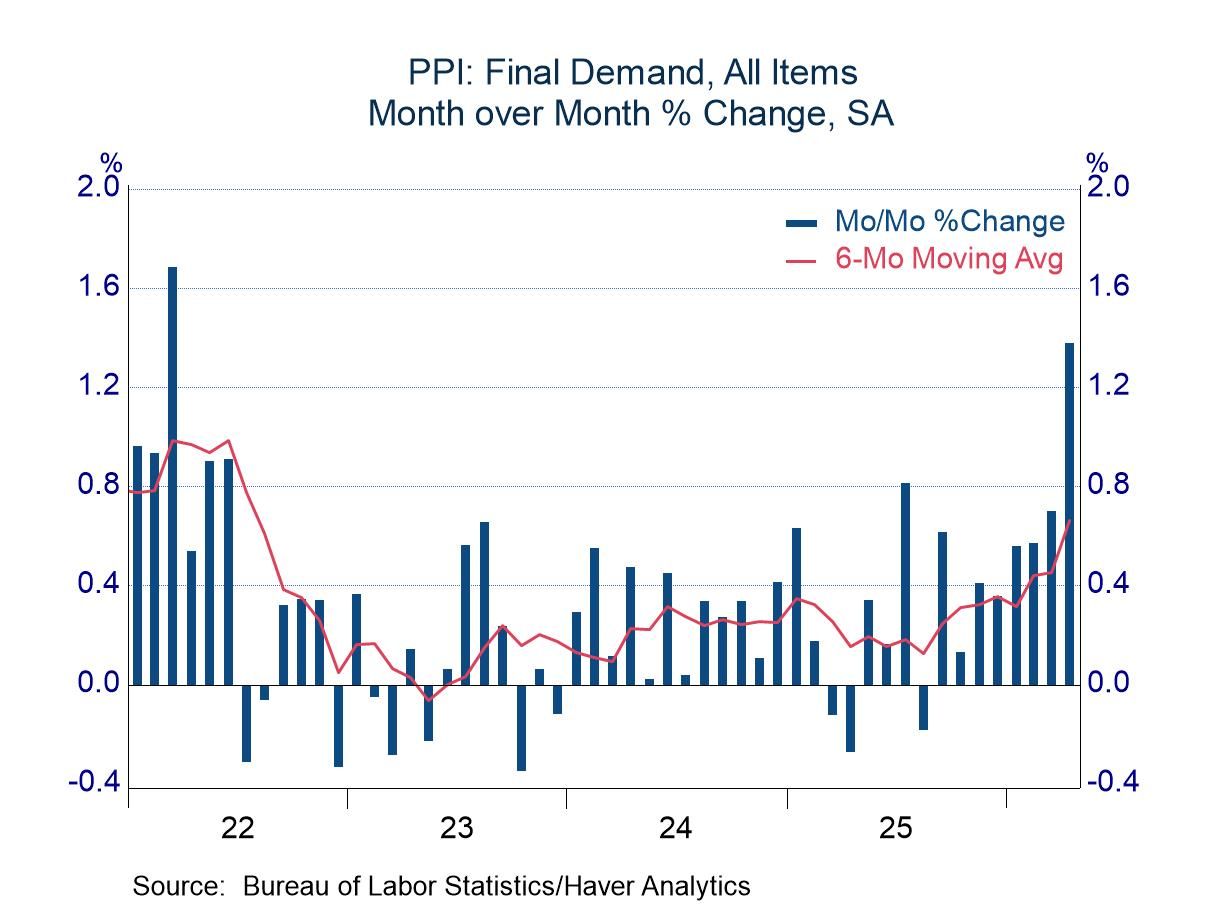
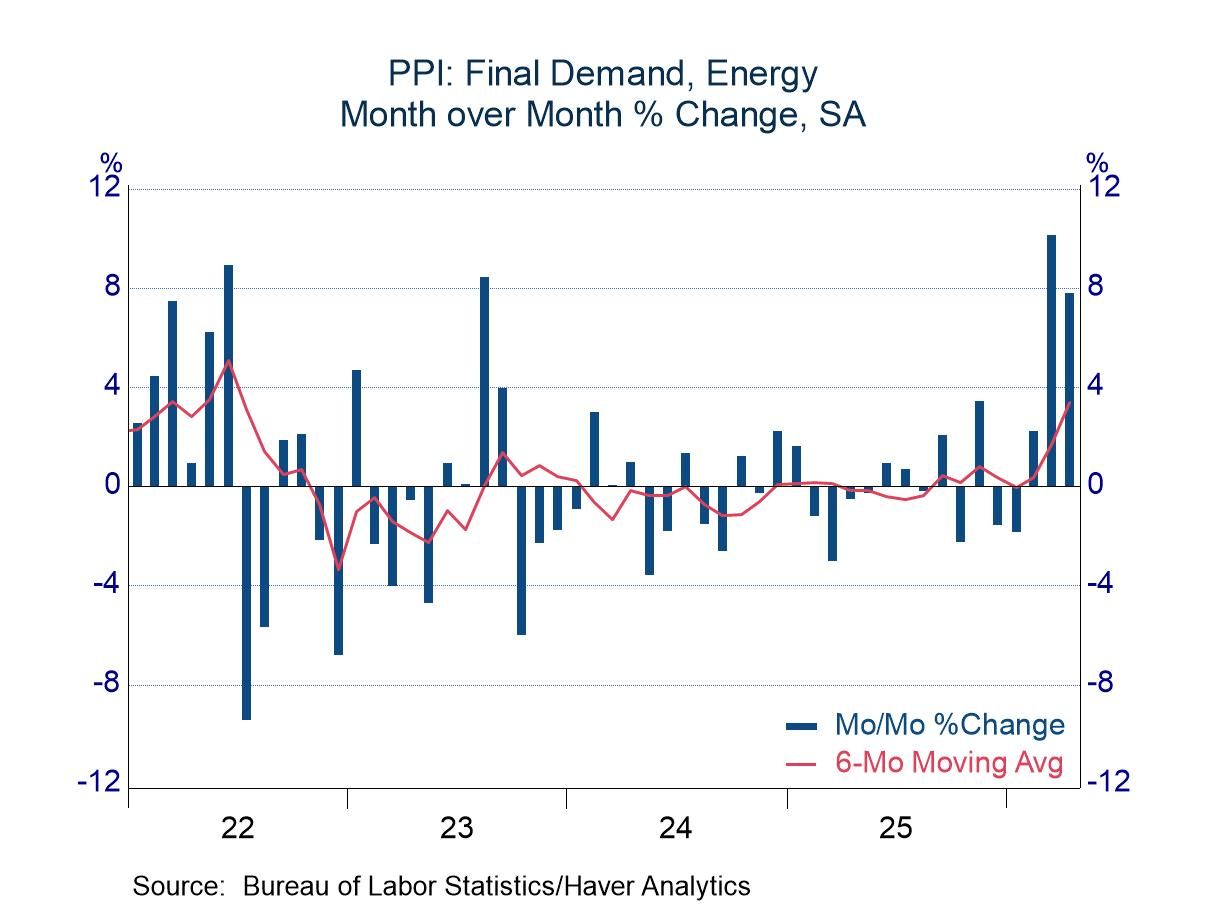
The Producer Price Index surged 1.4% in April, far in excess of the expected increase of 0.5%. Energy prices accounted for much of the increase with a jump of 7.8%, a much sharper change than the advance of 3.8% in the CPI. The marked difference between the energy components of the CPI and the PPI was primarily due to the nature of the customers. The Consumer Price Index, naturally, collects prices paid by individuals; the PPI, in addition to individuals, collects prices paid by businesses, governments, and exporters. Energy prices paid by governments and exporters rose sharply (12.1% and 15.8%, respectively). The PPI also showed a sharp increase in energy prices paid by individuals (6.1% versus 3.8% in the CPI).
Service prices also contributed to the high-side surprise in the PPI, posting an increase of 1.2%. This area often moves erratically, but still the latest move can be viewed as unusual, as it marked the second largest increase in service prices since the current structure of the PPI began in 2010 (three other observations were close with increases of 1.1%; the largest increase was 1.3% during the inflation burst in 2022).
Goods prices other than energy items were tame compared with service prices, but they too were unsettling. This grouping posted an increase of 0.6%, a reading in the upper end of the range from the past few years. The increase, although pronounced, was not broadly based. In a list of 53 non-energy goods provided by the BLS, only 13 posted increases of 0.4% or more, although a handful were especially sharp (electronic components 8.1%, industrial chemicals 4.4%, household furniture 1.8%).
Food represented the only major grouping that was not troubling, registering an increase of 0.2%.
The PPI data are published by the Bureau of Labor Statistics and can be found in Haver’s USECON database. Further detail is contained in PPI and PPIR. The expectations figures are available in the AS1REPNA database.

Michael J. Moran
AuthorMore in Author Profile »Before joining Haver Analytics in 2025, Michael J. Moran was the chief economist of Daiwa Capital Markets America Inc. He was responsible for preparing the firm’s economic forecast and interest rate outlook. He traveled frequently to visit the clients of Daiwa Capital Markets and wrote weekly economic commentary. Mr. Moran also was involved in the flux of financial markets, as he spent a portion of each day on Daiwa’s trading floor interpreting economic statistics and Federal Reserve activity for traders and salespeople. Mr. Moran is quoted frequently in the financial press, and he appears regularly on cable news shows. He also has published articles in several journals and periodicals. Before joining Daiwa Capital Markets America, Mr. Moran worked as an economist at the Federal Reserve Board in Washington, D.C. where he analyzed a broad range of issues dealing with the financial sector of the economy and regularly briefed the Board of Governors. He was on the faculty of Pennsylvania State University from 1979 to 1980 and taught on a part-time basis at George Washington University from 1980 to 1987.
Mr. Moran received his Ph.D. in economics from Pennsylvania State University in 1980 and a B.S. in business administration from the University of Bridgeport in 1975. He was a CFA charter holder from 2002 until 2016.
More Economy in Brief


 Global