 Global| Jan 11 2008
U.S. Trade Deficit Deepest Since Last August, Oil Imports Surged
by:Tom Moeller
|in:Economy in Brief
Summary
The U.S. foreign trade deficit deepened to $63.1B in November from an unrevised $57.8B during October. Consensus expectations had been for a deficit of $60.0B. During the first eleven months of 2007 the deficit averaged $59.1B versus [...]
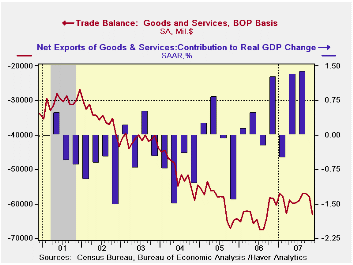
The U.S. foreign trade deficit deepened to $63.1B in November from an unrevised $57.8B during October. Consensus expectations had been for a deficit of $60.0B.
During the first eleven months of 2007 the deficit averaged $59.1B versus an average of $63.5B during the first eleven months of 2006.
U.S. exports rose 0.4% after an unrevised 0.9% gain during October. During the first eleven months of last year exports rose 12.3%.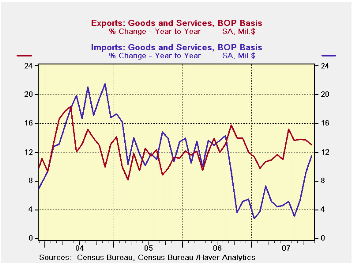
Exports of goods ticked up just 0.1% (13.7% y/y) after a 0.5% advance during October. The latest was the smallest rise since a slight decline last April. Exports of capital goods reversed much of an October surge with a 2.3% (+6.1% y/y) drop. Exports of civilian aircraft (-2.4% y/y) reversed nearly all of an 18.7% drop. Exports of computers surged 8.6% (22.3% y/y) but nonfood exports less autos fell 0.9% (+8.9% y/y).
U.S. exports of services rose another strong 1.3% (11.4 y/y). Travel exports jumped again by 1.1% (21.2% y/y) and passenger fares surged 2.1% (18.1% y/y).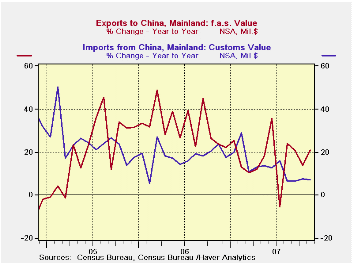
Overall imports surged 3.0% as higher oil prices raised petroleum imports by 16.3%. The quantity of energy related products fell 3.3% (+3.1% y/y) but the per barrel price of crude petroleum surged 9.9% (52.5% y/y). Imports of nonauto consumer goods surged 2.0% (4.1% y/y) after a strong 1.2% October gain but capital goods imports rose just 0.4% (5.9% y/y) after a 1.4% October decline.
Imports of services rose 0.4% (8.3% y/y) after a 1.0% October increase.
The U.S. trade deficit in goods with China improved slightly m/m to $24.0B. During the first eleven months of 2007 the deficit with China averaged $21.6B versus $19.4B in 2006. Exports to China rose 20.9% y/y and imports rose 7.2%.
Yesterday's speech titled Financial Markets, the Economic Outlook, and Monetary Policy by Federal Reserve Chairman Ben S. Bernanke can be found here.
| Foreign Trade | November | October | Y/Y | 2006 | 2005 | 2004 |
|---|---|---|---|---|---|---|
| U.S. Trade Deficit | $63.1B | $57.8B | $58.5B (11/06) |
$758.5 | $714.4B | $612.1B |
| Exports - Goods & Services | 0.4% | 0.9% | 13.0% | 12.7% | 10.9% | 13.7% |
| Imports - Goods & Services | 3.0% | 1.0% | 11.4% | 10.4% | 12.9% | 16.8% |
| Petroleum | 16.3% | 8.4% | 55.5% | 20.1% | 39.6% | 35.6% |
| Nonpetroleum Goods | 1.0% | -0.4% | 4.8% | 9.1% | 10.3% | 14.7% |

Tom Moeller
AuthorMore in Author Profile »Prior to joining Haver Analytics in 2000, Mr. Moeller worked as the Economist at Chancellor Capital Management from 1985 to 1999. There, he developed comprehensive economic forecasts and interpreted economic data for equity and fixed income portfolio managers. Also at Chancellor, Mr. Moeller worked as an equity analyst and was responsible for researching and rating companies in the economically sensitive automobile and housing industries for investment in Chancellor’s equity portfolio. Prior to joining Chancellor, Mr. Moeller was an Economist at Citibank from 1979 to 1984. He also analyzed pricing behavior in the metals industry for the Council on Wage and Price Stability in Washington, D.C. In 1999, Mr. Moeller received the award for most accurate forecast from the Forecasters' Club of New York. From 1990 to 1992 he was President of the New York Association for Business Economists. Mr. Moeller earned an M.B.A. in Finance from Fordham University, where he graduated in 1987. He holds a Bachelor of Arts in Economics from George Washington University.
More Economy in Brief


