December PPI: Marked Shifts in Volatile Areas; Underlying Trends Steady
Summary
- Prices of food and energy declined in December, but service prices surged.
- Prices of goods excluding food and energy rose more than the recent average, but the change did little damage to the underlying trend.
The Producer Price Index rose 0.5% in December, exceeding both the expected increase of 0.2% and the average advance of 0.3% in the prior six months. However, a surge of 0.7% in the service category accounted for much of the increase. The service component often moves erratically, and thus the sizeable increase in the headline index is not especially troubling. Within services, trade services are especially volatile, and prices here jumped 1.7% in December. Lower prices of food and energy (-0.3% and -1.4%, respectively) offset some of the pressure in the service area.
Prices of goods excluding food and energy, a grouping that shows less volatility than the food, energy, and service areas, rose 0.4% in December. The increase exceeded the average of 0.3% in the prior six months, but goods destined for export pushed the measure higher, jumping 0.7%. Goods intended for the domestic market (consumers, businesses, governments) saw price increases close to the recent average of 0.3%.
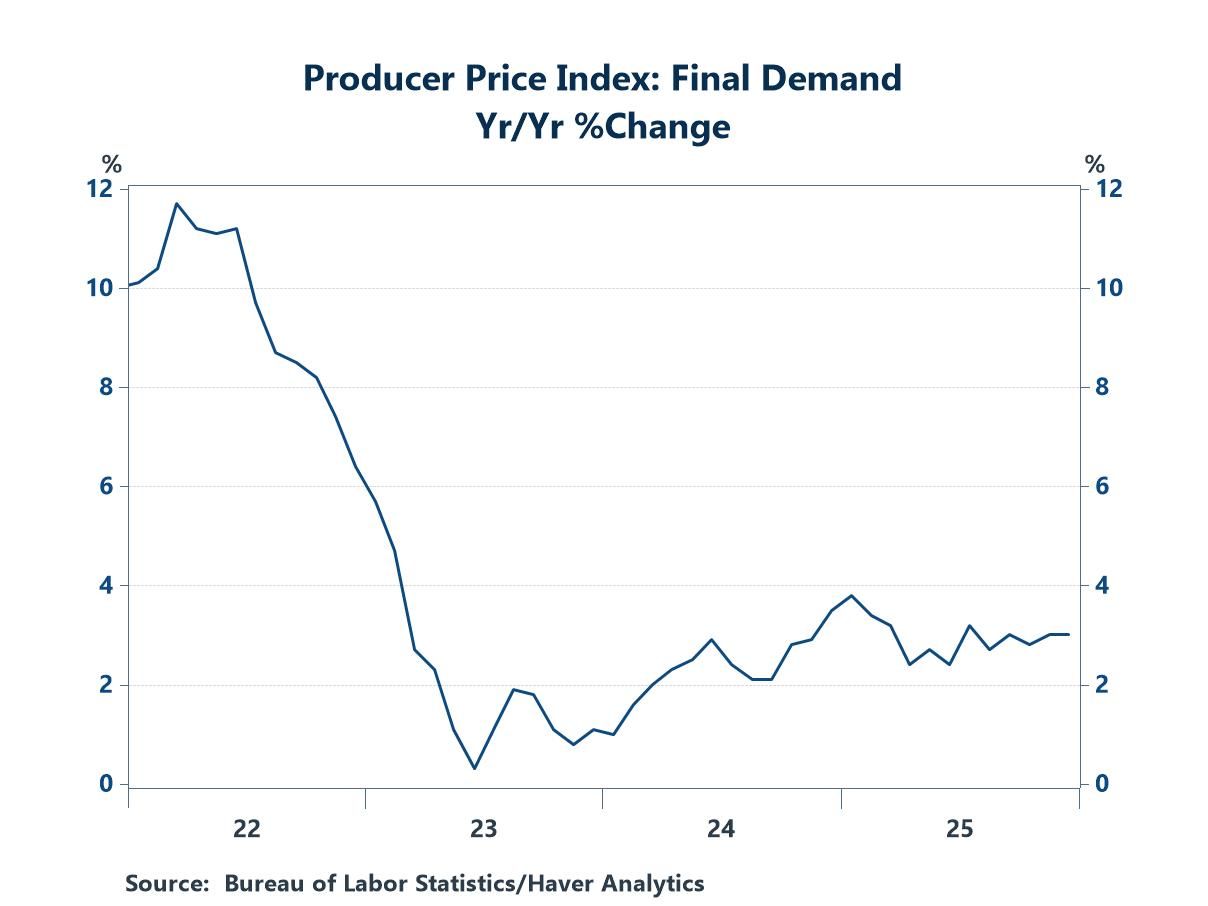
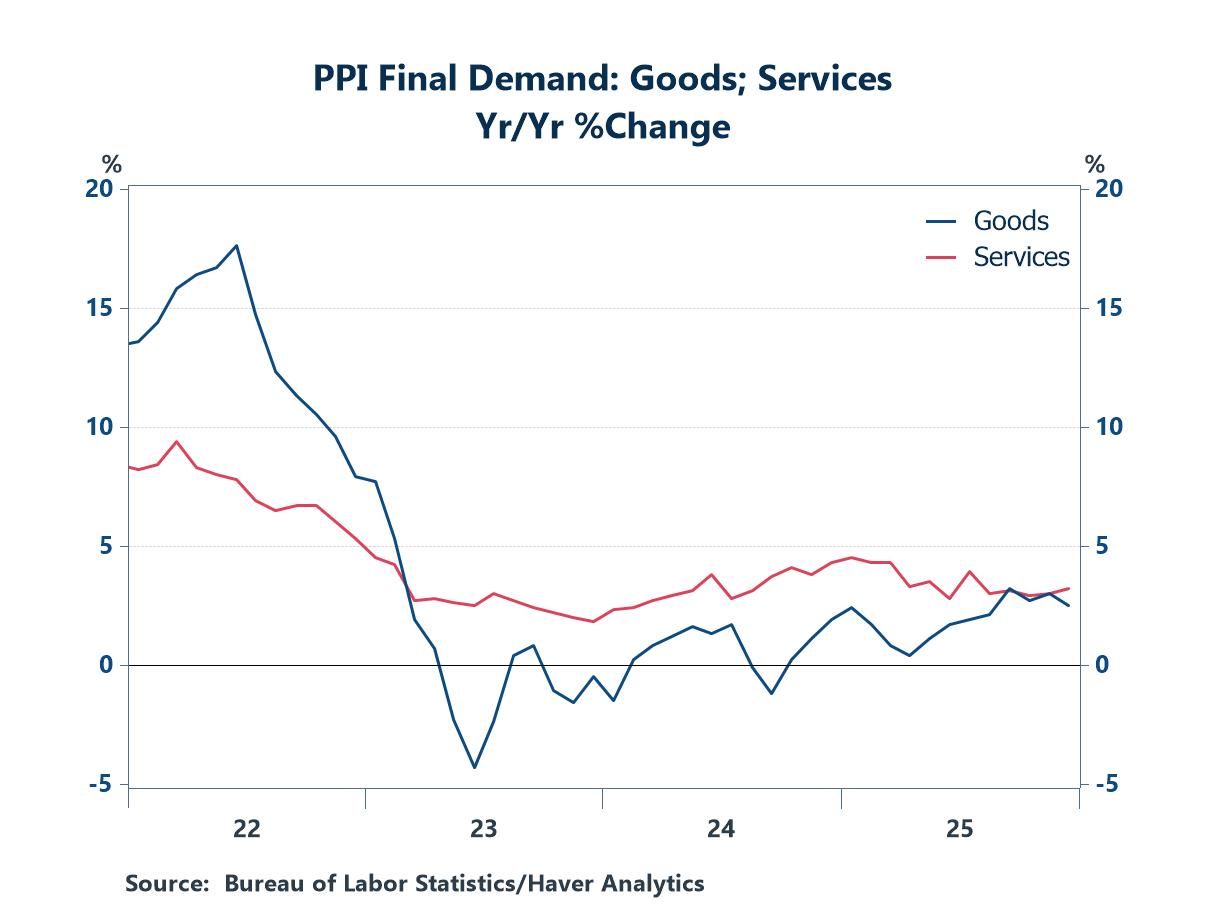
While the latest report on producer prices showed several notable shifts, underlying trends were little changed. The year-over-year increase in final-demand prices (the headline measure in this report) totaled 3.0% in December, a reading comfortably within the range evident since mid-2024 (chart, above left). The year-over-year increases in the goods and services categories changed only marginally: slightly higher for services and a tad lower for goods (chart, above right).
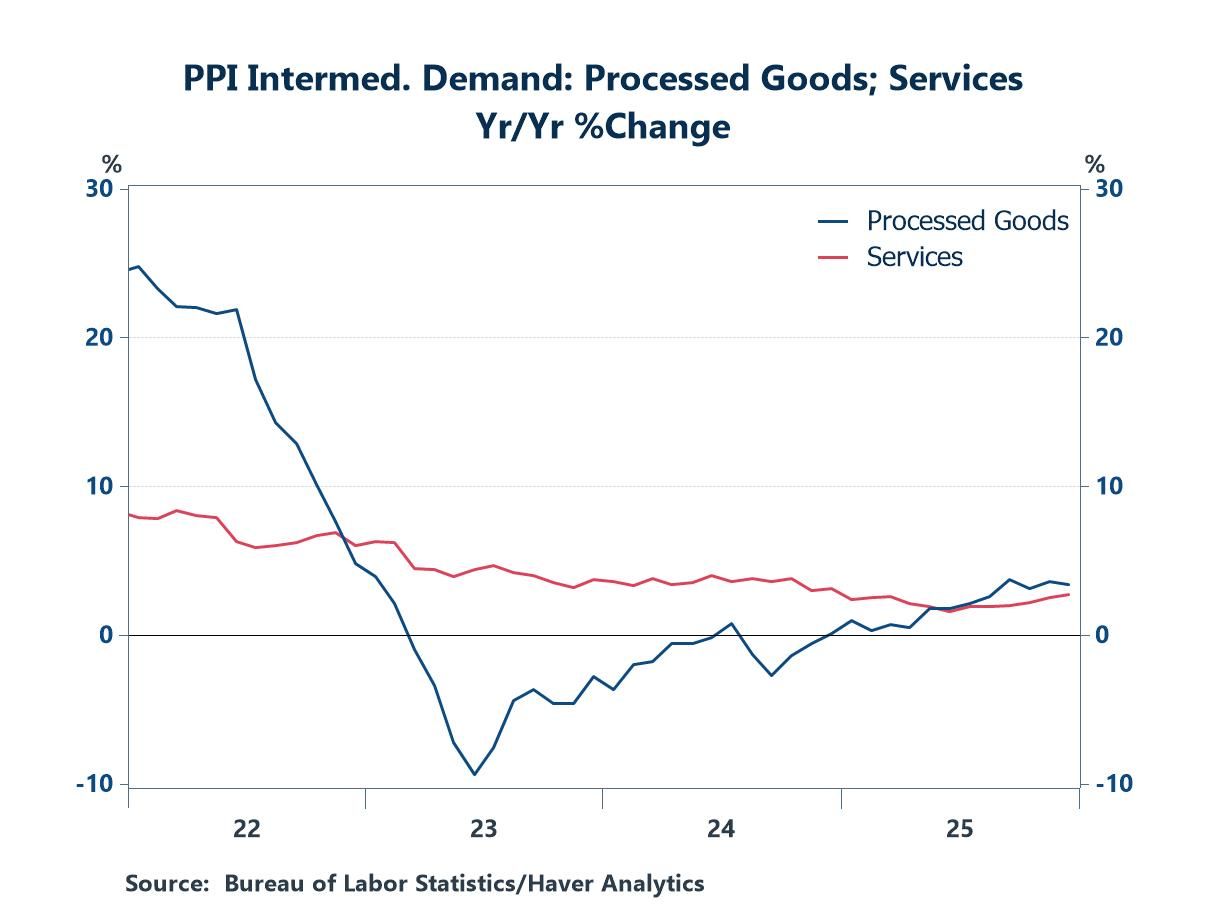
The monthly report on the PPI also includes prices on intermediate goods and services, which might provide insight into final prices in coming months. The service category has been moving along a steady path, with year-over-year changes running in a range of approximately 1.5% to 2.5%. Prices of intermediate goods have been trending upward, moving from deflation during much of 2023-24 to an average year-over-year increase of approximately 3.5% in the past four months.
The PPI data are published by the Bureau of Labor Statistics and can be found in Haver’s USECON database. Further detail is contained in PPI and PPIR. The expectations figures are available in the AS1REPNA database.

Michael J. Moran
AuthorMore in Author Profile »Before joining Haver Analytics in 2025, Michael J. Moran was the chief economist of Daiwa Capital Markets America Inc. He was responsible for preparing the firm’s economic forecast and interest rate outlook. He traveled frequently to visit the clients of Daiwa Capital Markets and wrote weekly economic commentary. Mr. Moran also was involved in the flux of financial markets, as he spent a portion of each day on Daiwa’s trading floor interpreting economic statistics and Federal Reserve activity for traders and salespeople. Mr. Moran is quoted frequently in the financial press, and he appears regularly on cable news shows. He also has published articles in several journals and periodicals. Before joining Daiwa Capital Markets America, Mr. Moran worked as an economist at the Federal Reserve Board in Washington, D.C. where he analyzed a broad range of issues dealing with the financial sector of the economy and regularly briefed the Board of Governors. He was on the faculty of Pennsylvania State University from 1979 to 1980 and taught on a part-time basis at George Washington University from 1980 to 1987.
Mr. Moran received his Ph.D. in economics from Pennsylvania State University in 1980 and a B.S. in business administration from the University of Bridgeport in 1975. He was a CFA charter holder from 2002 until 2016.
More Economy in Brief


 Global
