 Global| Oct 08 2010
U.S. Private-Sector Payrolls Gain Modestly; Jobless Rate Steady
by:Tom Moeller
|in:Economy in Brief
Summary
Job creation in the overall U.S. job market has yet to amount to much. Private sector nonfarm payrolls rose just 64,000 last month following increases of 93,000 and 117,000 during August and July, respectively. These gains continue to [...]
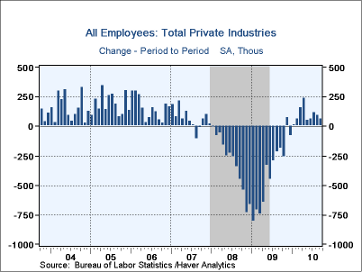
Job creation in the overall U.S. job market has yet to amount to much. Private sector nonfarm payrolls rose just 64,000 last month following increases of 93,000 and 117,000 during August and July, respectively. These gains continue to pale in comparison to those after past deep recessions. The 95,000 decline in total payrolls reflects the letting go of 76,000 Census takers. Overall, the figures were weaker than Consensus expectations for a 5,000 increase in total payrolls. Illustrative of weakness, private sector payrolls so far this year have risen just 1.1% (AR) following last year's record 5.2% decline.
Amongst sectors, a 21,000 decline in construction jobs last month followed an upwardly revised 31,000 August increase. In 2010, construction payrolls have fallen at a 2.1% rate. Factory jobs fell another 6,000 after a little-revised 28,000 August drop. They've risen at a 1.6% rate this year after the 11.3% decline in 2009. Private service-sector payrolls have performed relatively well. They rose 86,000 last month but at a (very) moderate 1.1% rate since December. Payrolls in information service industries fell at a 1.8% rate since December and in finance they fell at a 1.8% rate. These declines contrast with a 2.0% increase in professional & business services and a 1.8% increase in education & health payrolls. Temporary employment increased 16,900 (23.4% y/y), about the same as in August. Amongst industries, 49.8% added to September payrolls, down from 54.6% during the last three months. Both figures are down from their April peaks.
Overall, individuals worked the same workweek on average (34.2 hours) as during three of the four prior months. This was improved from last year's monthly low of 33.7 hours. The 40.1 hour factory sector workweek was the longest compared to a 33.1 hour week in the private service sector. Last quarter, aggregate hours worked (employment times hours) increased 0.5% after the 0.8% 2Q increase.
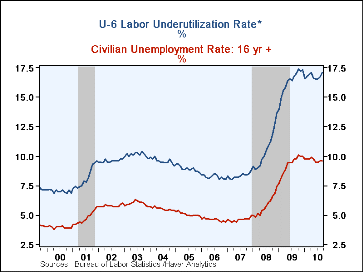
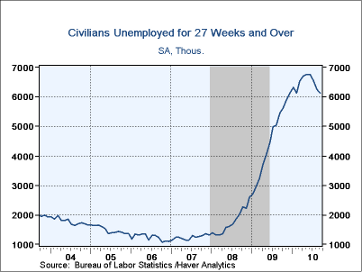
Just moderate growth in September payrolls was accompanied by a stable unemployment rate at 9.6%, slightly below the expected 9.7%. The stability owed to a 48,000 (0.2% y/y) rise in the labor force and a 141,000 gain (0.4% y/y) in employment. The labor force participation rate held steady at 64.7%, nearly the lowest since 1985. More than six million individuals are currently not in the labor force but want a job. Labor-market underutilization was further evident in the 17.1% of workers who were either unemployed, "marginally" attached or involuntarily employed part-time. The average duration of unemployment slipped to 33.3 weeks from last month's high of 33.6. A lessened 41.7% had been unemployed for 27 weeks or more.
The figures referenced above are available in Haver's USECON database. Additional detail can be found in the LABOR and in the EMPL databases
Can The Nation Stimulate Its Way To Prosperity? from the Federal Reserve Bank of Dallas is available here.
| Employment: 000s | September | August | July | Y/Y | 2009 | 2008 | 2007 |
|---|---|---|---|---|---|---|---|
| Payroll Employment | -95 | -57 | -66 | 0.3% | -4.3% | -0.6% | 1.1% |
| Previous | -- | -54 | -54 | -- | -- | -- | -- |
| Manufacturing | -6 | -28 | 32 | 0.3% | -11.3% | -3.4% | -2.0% |
| Construction | -21 | 31 | -2 | -3.6% | -15.7% | -6.1% | -0.8% |
| Private Service Producing | 86 | 83 | 80 | 0.8% | -3.4% | -0.2% | 1.7% |
| Government | -159 | -150 | -183 | -1.1% | 0.2% | 1.3% | 1.1% |
| Average Weekly Hours | 34.2 | 34.2 | 34.2 | 33.8(Sept. '09) | 33.1 | 33.6 | 33.8 |
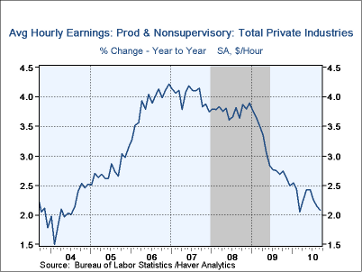
| Average Hourly Earnings | 0.1% | 0.3% | 0.1% | 2.1% | 3.0% | 3.8% | 4.0% |
| Unemployment Rate (%) | 9.6 | 9.6 | 9.5 | 9.8(Sept.'09) | 9.3 | 5.8 | 4.6 |
* U-6 Total unemployed plus all marginally attached workers plus total employed part time for economic reasons as a percent of the CLF plus all marginally attached workers
Tom Moeller
AuthorMore in Author Profile »Prior to joining Haver Analytics in 2000, Mr. Moeller worked as the Economist at Chancellor Capital Management from 1985 to 1999. There, he developed comprehensive economic forecasts and interpreted economic data for equity and fixed income portfolio managers. Also at Chancellor, Mr. Moeller worked as an equity analyst and was responsible for researching and rating companies in the economically sensitive automobile and housing industries for investment in Chancellor’s equity portfolio. Prior to joining Chancellor, Mr. Moeller was an Economist at Citibank from 1979 to 1984. He also analyzed pricing behavior in the metals industry for the Council on Wage and Price Stability in Washington, D.C. In 1999, Mr. Moeller received the award for most accurate forecast from the Forecasters' Club of New York. From 1990 to 1992 he was President of the New York Association for Business Economists. Mr. Moeller earned an M.B.A. in Finance from Fordham University, where he graduated in 1987. He holds a Bachelor of Arts in Economics from George Washington University.


