 Global| Feb 07 2008
U.S. Pending Home Sales Seeking a Bottom?
by:Tom Moeller
|in:Economy in Brief
Summary
The National Association of Realtors reported that the level of pending home sales in December fell 1.5% from November following that month's decline of 3.0%. These notable declines, however, followed increases during the prior two [...]
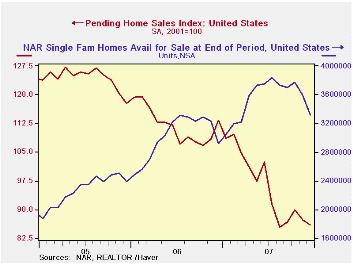
The National Association of Realtors reported that the level of pending home sales in December fell 1.5% from November following that month's decline of 3.0%. These notable declines, however, followed increases during the prior two months. The December decline therefore left sales at the cycle's low set in August. The pattern of sales since then has been essentially sideways.
Despite the sideways movement, the latest monthly figure is about one third below the peak level during the Summer of 2005. The data date back only to 2001.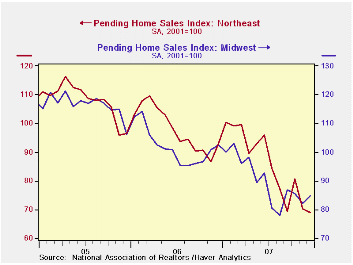
These figures are analogous to the new home sales data from the Commerce Dept. They measure existing home sales when the sales contract is signed, not at the time the sale is closed.
The Realtors also indicated in an earlier report that the number of homes on the market and available for sale fell 7.4% to 390,500 units in December. That was the lowest level since March. For all of 2007, however, the inventory of unsold homes rose 13.2% after huge increases of 21.2% and 26.8% during the prior two years.
In the Northeast, pending home sales fell 1.7% after a 13.0% m/m decline in November. For the year sales fell 12.6% following 2006's decline of 9.2%. Sales out West also fell a sharp 3.1% after a 2.1% November drop and for the year were down 15.8% after a 14.8% shortfall in 2006.
Sales in the Midwest sales ended the year with a 3.4% gain and since August have shown a very slight upward tilt. For the year sales fell 12.0% after the 12.4% 2006 decline. In the South sales fell another 3.0% in December to a new cycle low. For the year sales in the South fell 15.7% after a relatively moderate 5.5% decline in 2006.
The pending home sales data are available in Haver's PREALTOR database and the number of homes on the market are in the REALTOR database.
| Pending Home Sales (2001=100) | December | November | Y/Y | 2007 | 2006 | 2005 |
|---|---|---|---|---|---|---|
| Total | 85.9 | 87.2 | -24.2% | 95.9 | 112.1 | 124.2 |
| Northeast | 68.9 | 70.1 | -26.0 | 85.7 | 98.0 | 108.0 |
| Midwest | 84.9 | 82.1 | -17.3 | 89.7 | 102.0 | 116.4 |
| South | 96.4 | 99.4 | -27.0 | 107.4 | 127.4 | 134.8 |
| West | 83.9 | 86.6 | -24.1 | 92.3 | 109.6 | 128.7 |

Tom Moeller
AuthorMore in Author Profile »Prior to joining Haver Analytics in 2000, Mr. Moeller worked as the Economist at Chancellor Capital Management from 1985 to 1999. There, he developed comprehensive economic forecasts and interpreted economic data for equity and fixed income portfolio managers. Also at Chancellor, Mr. Moeller worked as an equity analyst and was responsible for researching and rating companies in the economically sensitive automobile and housing industries for investment in Chancellor’s equity portfolio. Prior to joining Chancellor, Mr. Moeller was an Economist at Citibank from 1979 to 1984. He also analyzed pricing behavior in the metals industry for the Council on Wage and Price Stability in Washington, D.C. In 1999, Mr. Moeller received the award for most accurate forecast from the Forecasters' Club of New York. From 1990 to 1992 he was President of the New York Association for Business Economists. Mr. Moeller earned an M.B.A. in Finance from Fordham University, where he graduated in 1987. He holds a Bachelor of Arts in Economics from George Washington University.
More Economy in Brief


