 Global| Jun 02 2009
U.S. Pending Home Sales Rise To Their Highest Level Since September
by:Tom Moeller
|in:Economy in Brief
Summary
The National Association of Realtors reported that pending sales of existing homes during April rose for the third consecutive month. The 6.7% m/m rise was to the highest level since last September and doubled the unrevised 3.2% March [...]
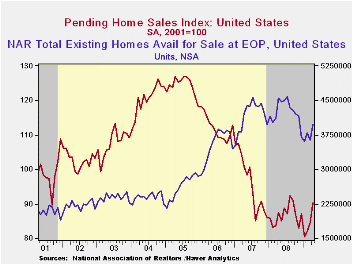
The National Association of Realtors reported that pending sales of existing homes during April rose for the third consecutive month. The 6.7% m/m rise was to the highest level since last September and doubled the unrevised 3.2% March gain. Consensus expectations had been for a slight 0.5% increase in April sales.
Last month's gain in home sales was spread across the country except in the South where they fell slightly from March (+3.6% y/y). In the West (-3.0%y/y) sales recovered a piece of March's decline but remained down sharply from the highs of last summer. Elsewhere, sales in the Northeast jumped by nearly one-third from the March level but they were roughly unchanged from one year earlier. Sales in the Midwest jumped 9.8% from March and have rebounded 11.1% versus 2008.
The home sales figures are analogous to the new home sales data from the Commerce Department in that they measure existing home sales when the sales contract is signed, not at the time the sale is closed. The series dates back to 2001.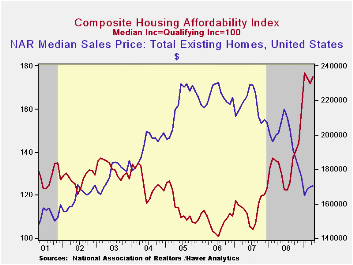
The latest monthly gains in home sales have been accompanied by a rise in home prices. The median sales price of an existing home increased a slight 0.2% in April (-15.4% y/y). The rise followed firm increases during the prior two months. The latest gains in home prices did lower housing affordability slightly but just slightly. Therefore, combined with lower interest rates, the affordability index of a home remained up by 29.2% year-to-year and by three quarters from the 2006 low. The latest level was a record high for the series which extends back to 1970.
As the Spring selling season began, the Realtors Association indicated in an earlier report that the number of homes on the market and available for sale rose 8.8% during April but were down 12.8% versus one year earlier. At the current sales rate there was a 10.2 months' supply of homes on the market and there was a 10.4 months' supply during all of last year, up from the 8.9 months supply during 2007 and 6.5 months during 2006. For single family homes, there was a 9.6 months' supply in April versus a full-year figure of 10.0 months during 2008.
The pending home sales data are available in Haver's PREALTOR database. The number of homes on the market and prices are in the REALTOR database.
| Pending Home Sales (2001=100) | April | March | Y/Y | 2008 | 2007 | 2006 |
|---|---|---|---|---|---|---|
| Total | 90.3 | 84.6 | 3.2% | 86.8 | 95.8 | 112.1 |
| Northeast | 78.9 | 59.5 | 0.8 | 72.6 | 85.6 | 98.5 |
| Midwest | 90.4 | 82.3 | 11.1 | 80.6 | 89.5 | 102.0 |
| South | 93.0 | 93.2 | 3.6 | 89.8 | 107.3 | 127.3 |
| West | 94.8 | 93.1 | -3.0 | 99.3 | 92.1 | 109.5 |

Tom Moeller
AuthorMore in Author Profile »Prior to joining Haver Analytics in 2000, Mr. Moeller worked as the Economist at Chancellor Capital Management from 1985 to 1999. There, he developed comprehensive economic forecasts and interpreted economic data for equity and fixed income portfolio managers. Also at Chancellor, Mr. Moeller worked as an equity analyst and was responsible for researching and rating companies in the economically sensitive automobile and housing industries for investment in Chancellor’s equity portfolio. Prior to joining Chancellor, Mr. Moeller was an Economist at Citibank from 1979 to 1984. He also analyzed pricing behavior in the metals industry for the Council on Wage and Price Stability in Washington, D.C. In 1999, Mr. Moeller received the award for most accurate forecast from the Forecasters' Club of New York. From 1990 to 1992 he was President of the New York Association for Business Economists. Mr. Moeller earned an M.B.A. in Finance from Fordham University, where he graduated in 1987. He holds a Bachelor of Arts in Economics from George Washington University.
More Economy in Brief


