 Global| Oct 03 2014
U.S. Payroll Employment Growth Recovers; Jobless Rate Continues Down
by:Tom Moeller
|in:Economy in Brief
Summary
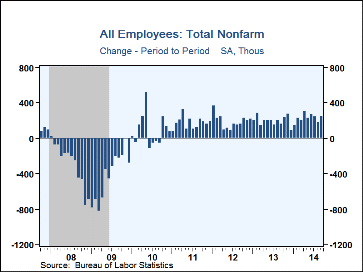
Nonfarm payroll employment posted a 248,000 increase during September (1.9% y/y) following upwardly revised gains of 180,000 and 243,000 during the prior two months. The rise exceeded expectations for a 215,000 increase in the Action [...]
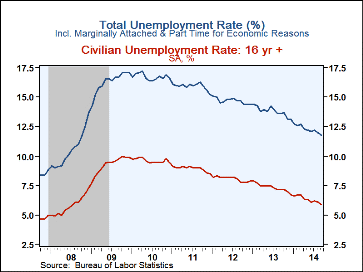
Nonfarm payroll employment posted a 248,000 increase during September (1.9% y/y) following upwardly revised gains of 180,000 and 243,000 during the prior two months. The rise exceeded expectations for a 215,000 increase in the Action Economics Forecast Survey. The decline in the unemployment rate to 5.9%, its lowest level since July 2008, also exceeded expectations for stability at 6.1%. The overall unemployment rate, including marginally attached workers and those employed part-time for economic reasons, fell to 11.8%.
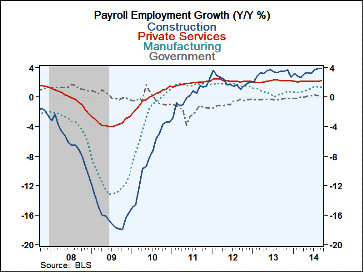
From the payroll survey, the 248,000 employment increase was the firmest since June. It left the three-month average at 224,000, its weakest since March. Factory payrolls recovered a minimal 4,000 which retraced the 4,000 August decline, revised from no change. Construction jobs gained 16,000 and repeated the August rise, revised from 20,000. Notable strength in last month's employment numbers was in the private service sector. The 207,000 increase followed a 161,000 rise that was revised from 112,000. Last month's strength spread across industry categories. Professional & business services jobs grew 81,000 (3.8% y/y), the strongest rise since February. Retail trade jobs recovered 35,300 (1.7% y/y) after a 4,700 August decline. Trade, transportation & utilities employment grew 37,000 (2.0% y/y) following a 9,000 advance. Job growth in leisure & hospitality businesses firmed to 33,000 (2.6% y/y), the strongest rise since May. Employment in information services rose 12,000 (0.4% y/y), the strongest gain in twelve months. These signs of job market improvement were countered, however, by a 32,000 rise (1.9% y/y) in education & health services employment, the weakest rise since April. Government sector jobs rose an improved 12,000 (0.2% y/y). The gain was powered by a 22,000 increase (0.4% y/y) in state payrolls, the strongest rise since August 2011. Federal government jobs fell 2,000 (-1.2% y/y) and local government employment declined 8,000 (+0.4% y/y), the first drop since December.
The average workweek lengthened to 34.6 hours. It was the longest workweek since May 2008. A lengthened private services workweek of 33.4 hours was driven by wholesale trade which rose to 39.0 hours. The factory sector workweek was stable at 40.9 hours but construction's workweek dipped to 39.0 hours. The service sector workweek improved to 33.4 hours.
Aggregate hours worked (employment times hours) rose 0.5% last month (2.6% y/y). That left the Q3 gain at 2.8% (AR, q/q), down from 3.8% in Q2. Since 2007, there's been a 68% correlation between quarterly growth in aggregate hours worked and real GDP. There's been an 88% correlation on a y/y basis.
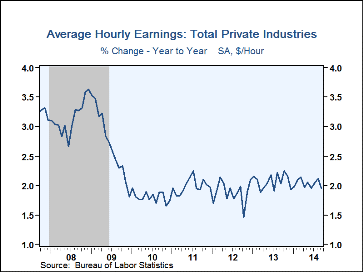
Average hourly earnings slipped negligibly m/m (+2.0% y/y). Factory sector earnings fell 0.3% (+1.3% y/y) but professional & business services earnings ticked 0.1% higher (2.6% y/y).
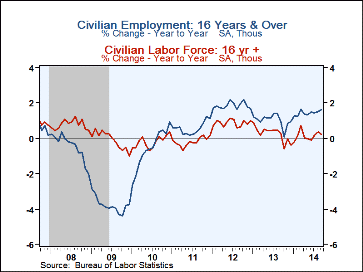
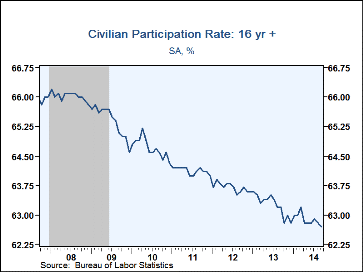
The household survey indicated that the unemployment rate's fall to 5.9% reflected a 0.2% rise (1.6% y/y) in employment and a 0.1% slip (+0.3% y/y) in the labor force. The number of unemployed fell 3.4% (17.3% y/y). The labor force participation rate fell to 62.7%, the lowest level since February 1978 and down from the 2000 annual high of 67.1%.
Twenty two percent of those unemployed were out of work for more than 52 weeks, down from 32% in 2011. Those out of work for 15-26 weeks accounted for 15.3% of those unemployed while those out of work 5-14 weeks accounted for 26.5% of the total.
The unemployment rate for those with less than a high school diploma fell to 8.4%, nearly half the high late in 2010. For high school graduates but no college the rate was 5.3%, half the 2010 high. For those with some college but no degree the rate held m/m at 5.4% but was down from its 8.5% high. For individuals with a bachelors degree or higher, the 2.9% rate compared to a 5.0% peak during 2010.
The figures referenced above are available in Haver's USECON database. Additional detail can be found in the LABOR and in the EMPL databases. The expectation figures are from Action Economics and are in the AS1REPNA database.
| Employment: (M/M Chg., 000s) | Sep | Aug | Jul | Y/Y | 2013 | 2012 | 2011 |
|---|---|---|---|---|---|---|---|
| Payroll Employment | 248 | 180 | 243 | 1.9% | 1.7% | 1.7% | 1.2% |
| Previous | -- | 142 | 212 | -- | -- | -- | -- |
| Manufacturing | 4 | -4 | 24 | 1.3 | 0.7 | 1.7 | 1.7 |
| Construction | 16 | 16 | 30 | 3.9 | 3.3 | 2.1 | 0.2 |
| Private Service Producing | 207 | 161 | 176 | 2.2 | 2.2 | 2.2 | 1.9 |
| Government | 12 | 5 | 4 | 0.2 | -0.3 | -0.8 | -1.8 |
| Average Weekly Hours - Private Sector | 34.6 | 34.5 | 34.5 | 34.5 (Sep'13) |
34.5 | 34.4 | 34.3 |
| Average Private Sector Hourly Earnings (%) | -0.0 | 0.3 | 0.0 | 2.0 | 2.1 | 1.9 | 2.0 |
| Unemployment Rate (%) | 5.9 | 6.1 | 6.2 | 7.2 (Sep'13) |
7.4 | 8.1 | 8.9 |
Tom Moeller
AuthorMore in Author Profile »Prior to joining Haver Analytics in 2000, Mr. Moeller worked as the Economist at Chancellor Capital Management from 1985 to 1999. There, he developed comprehensive economic forecasts and interpreted economic data for equity and fixed income portfolio managers. Also at Chancellor, Mr. Moeller worked as an equity analyst and was responsible for researching and rating companies in the economically sensitive automobile and housing industries for investment in Chancellor’s equity portfolio. Prior to joining Chancellor, Mr. Moeller was an Economist at Citibank from 1979 to 1984. He also analyzed pricing behavior in the metals industry for the Council on Wage and Price Stability in Washington, D.C. In 1999, Mr. Moeller received the award for most accurate forecast from the Forecasters' Club of New York. From 1990 to 1992 he was President of the New York Association for Business Economists. Mr. Moeller earned an M.B.A. in Finance from Fordham University, where he graduated in 1987. He holds a Bachelor of Arts in Economics from George Washington University.


