 Global| Jan 29 2026
Charts of the Week: Weaker Dollar, Stronger Tech
by:Andrew Cates
|in:Economy in Brief
Summary
Financial markets have seen renewed gyrations in recent weeks, with a weaker US dollar, higher interest rate volatility and shifting capital flows reviving discussion of a “Sell America” narrative — so far more a marginal rebalancing than a wholesale retreat. The Federal Open Market Committee left the federal funds rate unchanged at its latest meeting, as widely expected, but communications around the outlook for future easing were arguably a little more hawkish than anticipated, reinforcing a cautious and increasingly data-dependent policy stance. In our charts this week we begin with January’s flash PMIs, which point to ongoing expansion across most major economies but with clear cross-country divergence in momentum (chart 1). That uneven real-economy picture has been mirrored in FX: the broad trade-weighted dollar depreciated through the first half of 2025, stabilised later in the year, but has now softened more abruptly at the start of 2026—suggesting a shift in risk premia and capital-flow dynamics (chart 2). Consistent with that, consumer confidence has weakened noticeably in the US relative to the euro area and UK, with the deterioration looking more tied to politics and labour-market perceptions (chart 3). Even so, global equity sentiment has remained comparatively upbeat, supported by a still-favourable macro mix in which global growth surprises have tended to run ahead of expectations while inflation surprises have been softer—tentatively consistent with an improving supply-side backdrop that markets increasingly associate with AI (chart 4). Finally, that theme is reinforced by hard activity indicators: US orders and imports of advanced technology products remain strong (chart 5), and Taiwan’s production data show a parallel surge in electronics output upstream (chart 6), pointing to a still-powerful global tech cycle even as broader macro and market narratives become more unsettled.
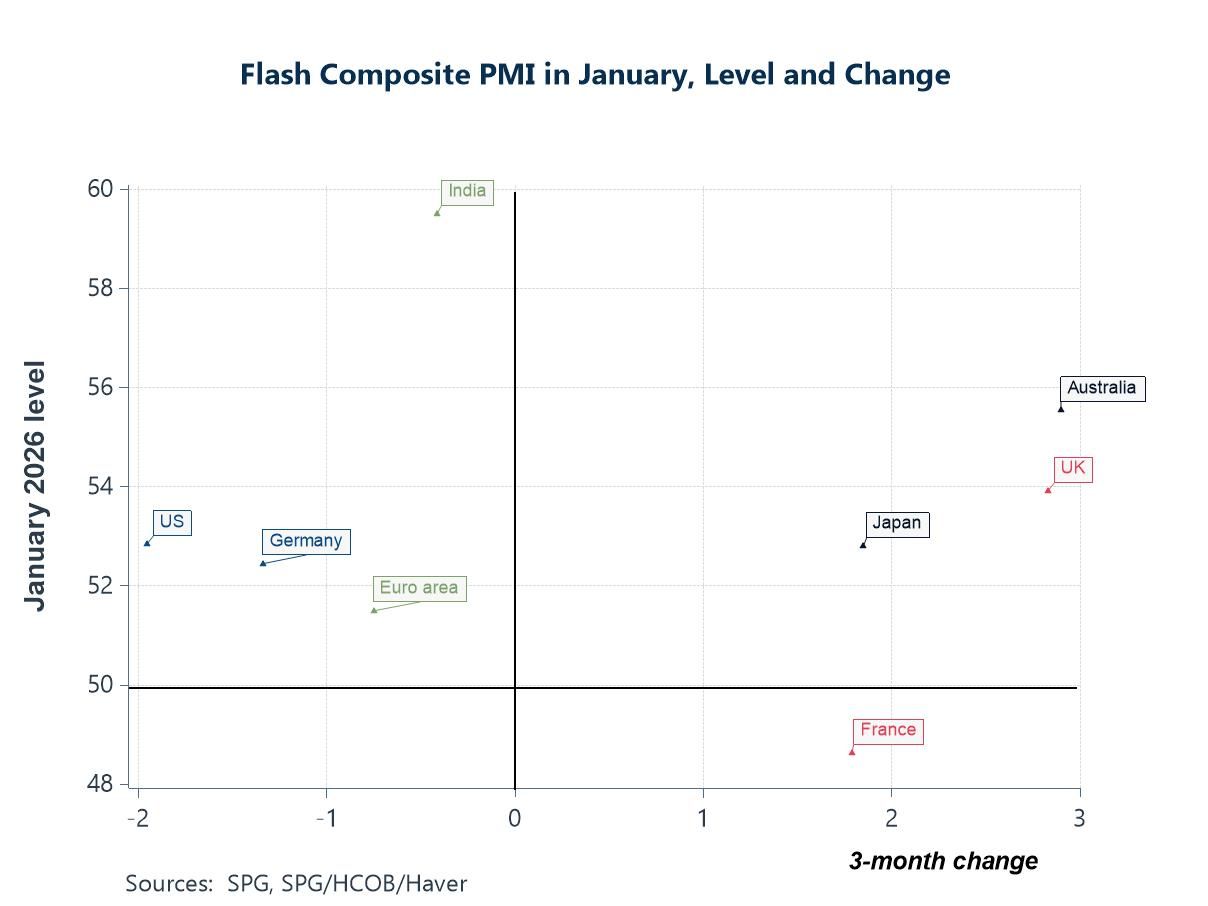
Global Growth Conditions Flash PMI readings for January 2026 point to a global growth backdrop that remains uneven, with notable differences across economies in both activity levels and recent momentum. Several economies, including the UK, Australia and Japan, are firmly in expansionary territory above the 50 threshold and have also recorded solid positive three-month gains, suggesting some strengthening in activity entering the new year. The euro area and Germany are also comfortably above 50, indicating ongoing expansion, although recent momentum has been more subdued compared with some peers. France stands out as the main laggard, with the composite PMI still below the expansion threshold despite an improvement over the past three months. The US, meanwhile, has seen some softening in recent momentum even as activity remains in expansionary territory. India continues to post the strongest headline reading, though with little additional acceleration. Overall, the flash PMI data continue to portray a global economy that is expanding, but in a differentiated and uneven fashion rather than through a synchronised upswing.
Chart 1: Flash PMIs in January: levels versus 3-month changes
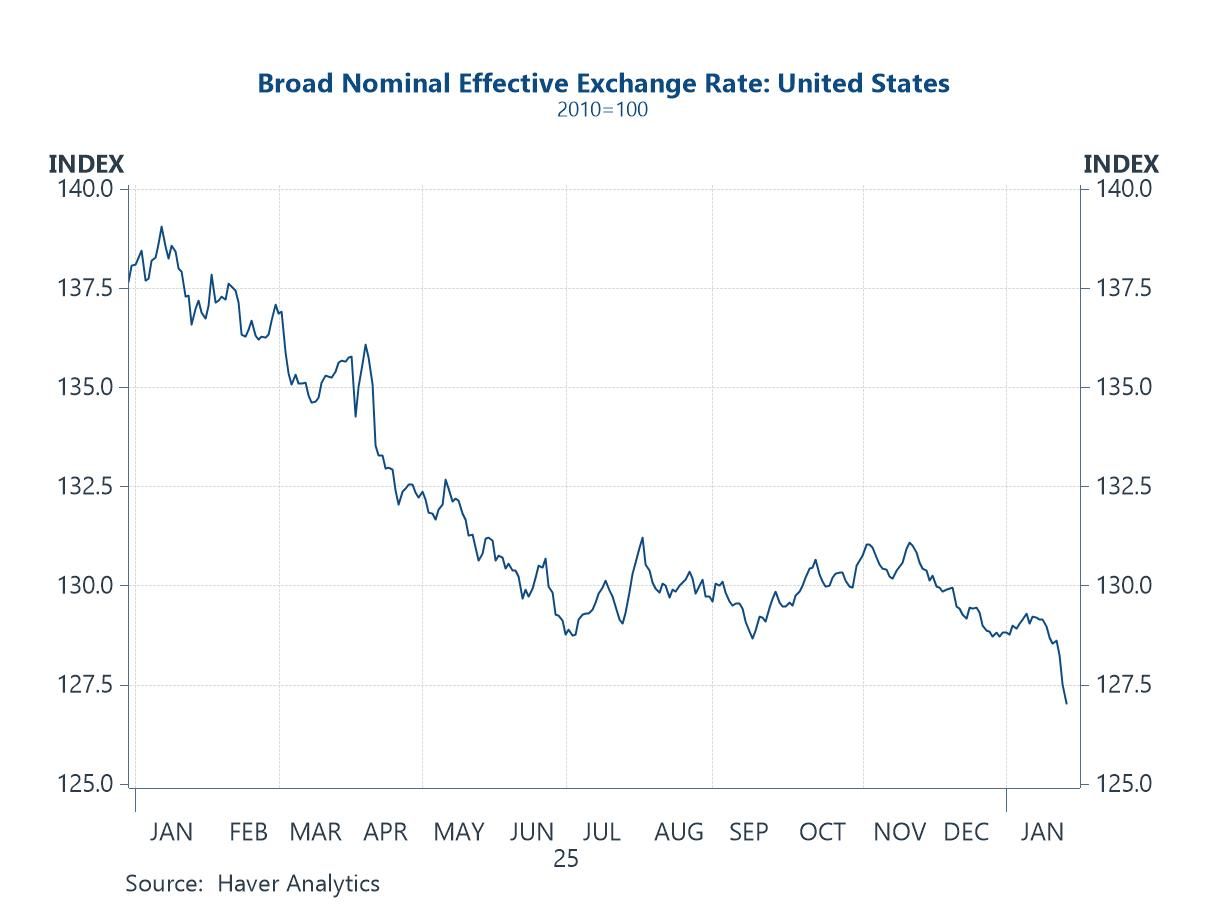
The US dollar Alongside the uneven global growth signals, financial markets have also begun to reflect a shifting pattern in demand for US assets. The chart below shows a notable depreciation in the broad nominal effective exchange rate of the US dollar through the first half of 2025, followed by a period of relative stabilisation in the second half of the year and a more abrupt weakening at the start of 2026. While the earlier decline likely reflected narrowing growth and interest-rate differentials, the recent sharper move points more clearly to changing capital-flow dynamics and a partial erosion of the dollar’s safe-haven appeal. Although far from a disorderly adjustment, the renewed softness has revived discussion of a broader “sell America” theme, suggesting that geopolitical uncertainty and policy risk may now be playing a larger role in currency markets alongside traditional cyclical drivers.
Chart 2: Haver’s daily trade weighted US dollar index
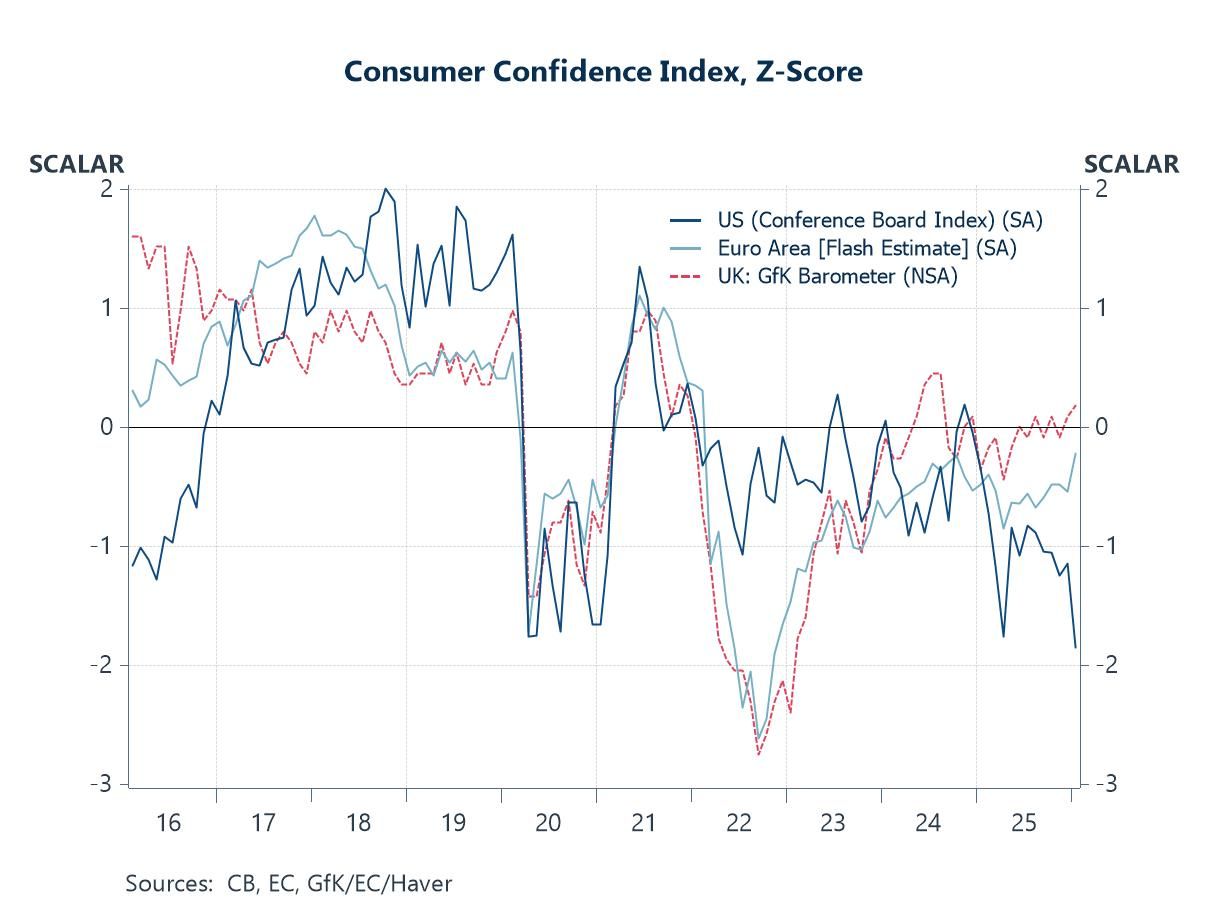
Consumer confidence in the US and Europe The recent depreciation in the US dollar has coincided with a marked relative weakness in US consumer confidence compared with other major economies. As the chart illustrates, this week’s data from the Conference Board revealed that US sentiment has fallen well below its long-run average and now sits at notably weaker levels than in both the euro area and the UK (based on normalised readings), where confidence has shown tentative signs of stabilisation. The deterioration in US readings appears less related to financial conditions and arguably more reflective of political uncertainty and a softening in labour-market perceptions.
Chart 3: Consumer confidence indices in the US, euro area and UK
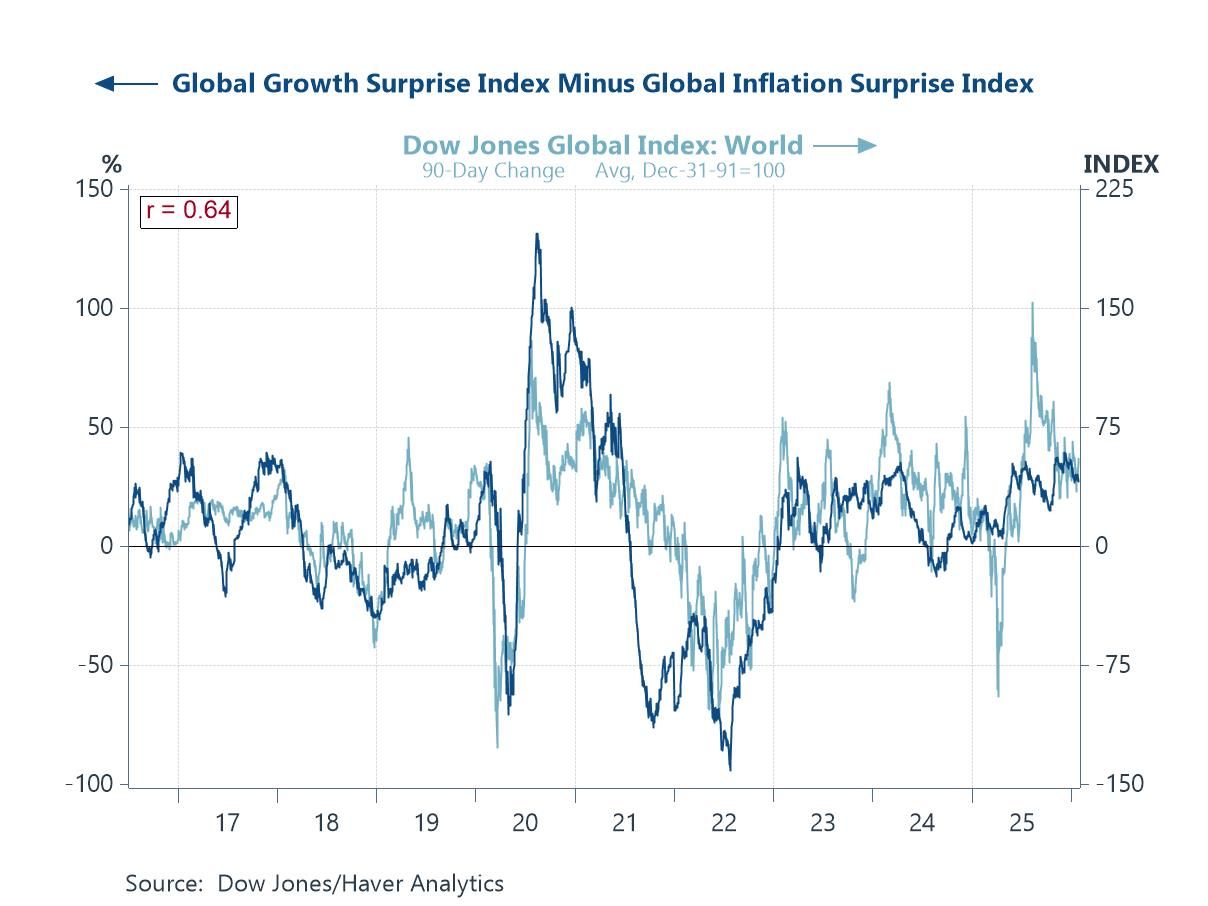
Financial markets and data surprises Despite the recent softness in the US dollar and signs of shifting capital flows, global equity markets have remained relatively upbeat, reflecting a still-supportive macro backdrop. As the chart illustrates, periods of stronger global growth surprises have tended to coincide with weaker inflation surprises, a combination that has historically been favourable for risk assets and has again been evident in recent months. This pattern tentatively points to an improving supply-side dynamic, where activity has been outperforming expectations without a corresponding resurgence in price pressures. One possible factor behind this development is the early impact of productivity-enhancing technologies, including artificial intelligence, which may be helping to lift growth while easing inflation constraints at the margin.
Chart 4: Global growth and inflation surprises versus global equity markets
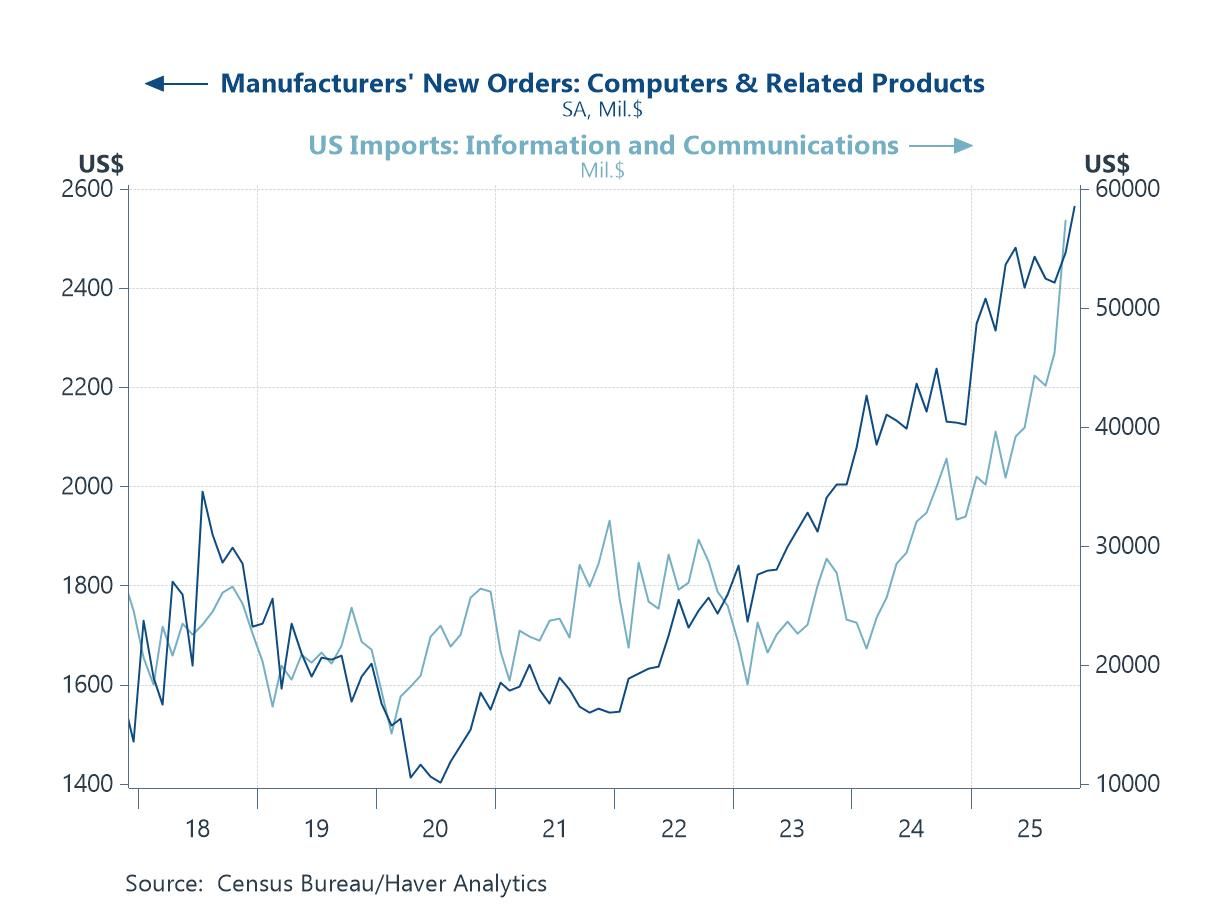
The US economy and AI Hard data released this week also continue to point to robust demand for advanced technology products in the US economy. The latest durable goods orders figures showed further strength in new orders for computers and related products, reinforcing the upward trend evident over the past two years. At the same time, recent trade data highlight a sustained rise in US imports of information and communications equipment, suggesting that domestic investment demand is being complemented by strong inflows of high-tech capital goods. Together, these series underscore the resilience of technology-related spending, consistent with ongoing investment linked to digitalisation, cloud infrastructure and artificial intelligence.
Chart 5: US high tech manufacturing new orders and imports
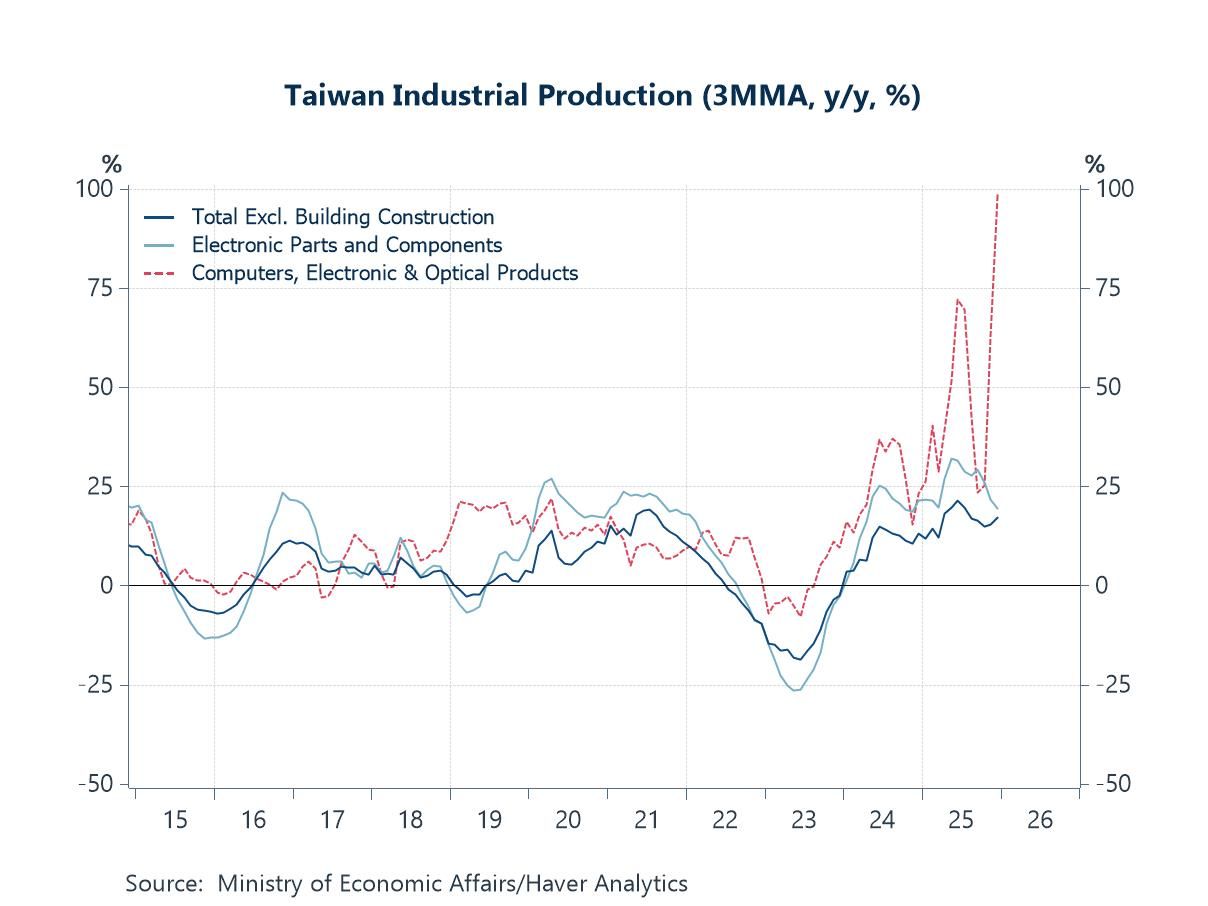
Industrial production in Taiwan The strength in US technology-related demand is also being echoed upstream in global supply chains, particularly in East Asia. As the chart shows, Taiwan’s industrial production has rebounded sharply over the past year, led by a pronounced acceleration in output of computers, electronic and optical products. Growth in electronic parts and components has likewise strengthened, outpacing the broader industrial sector and underscoring the central role of the semiconductor and advanced electronics cycle in the current upturn. This pickup aligns closely with the robust US orders and import data discussed above, suggesting that strong end-demand for high-tech equipment is translating into rising production across key manufacturing hubs.
Chart 6: Taiwan’s industrial production growth

Andrew Cates
AuthorMore in Author Profile »Andy Cates joined Haver Analytics as a Senior Economist in 2020. Andy has more than 25 years of experience forecasting the global economic outlook and in assessing the implications for policy settings and financial markets. He has held various senior positions in London in a number of Investment Banks including as Head of Developed Markets Economics at Nomura and as Chief Eurozone Economist at RBS. These followed a spell of 21 years as Senior International Economist at UBS, 5 of which were spent in Singapore. Prior to his time in financial services Andy was a UK economist at HM Treasury in London holding positions in the domestic forecasting and macroeconomic modelling units. He has a BA in Economics from the University of York and an MSc in Economics and Econometrics from the University of Southampton.
More Economy in Brief


