 Global| Jun 18 2009
U.S. Leading Indicators Rise Sharply For A Second Month
by:Tom Moeller
|in:Economy in Brief
Summary
The Conference Board's leading index again suggested a coming turn in economic activity. The May composite index of leading economic indicators jumped another 1.2% following the upwardly revised 1.1% April gain. The increases [...]
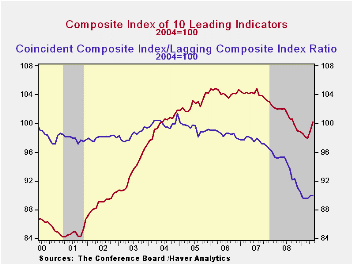
The Conference Board's leading index again suggested a coming turn in economic activity. The May composite index of leading economic indicators jumped another 1.2% following the upwardly revised 1.1% April gain. The increases recovered the declines during the prior several months and left the index at its highest level since last September. The leading index is based on actual reports for eight economic data series. The Conference Board initially estimates two series, orders for consumer goods and orders for capital goods.
Nearly three quarters of the ten components of the leading index increased last month with the largest positive contributions coming from higher stock prices, a higher money supply, a more positively sloped interest rate yield curve and vendor performance (slower delivery speeds). Initial unemployment insurance claims, weekly hours worked and factory orders made negative contributions.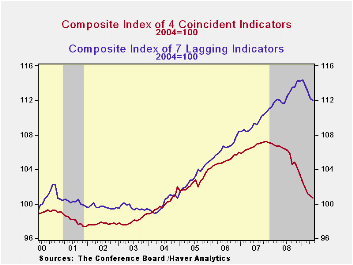
Suggesting that the rate of decline in the economy is slowing were the coincident indicators. They fell 0.2% for the second month and that compared with 0.6% to 1.1% monthly declines since last September. The negative contributions from lower employment and production eased. Half of the four component series rose during May led by gains in real disposable income and business sales. Over the last ten years there has been a 76% correlation between this y/y change and real GDP.
In a sign that excesses in the U.S. economy are diminishing, the lagging index fell for the fifth month in the last six. The ratio of coincident-to-lagging indicators (a measure of economic excess) was unchanged m/m at the highest level this year.The Conference Board figures are available in Haver's BCI database. Visit the Conference Board's site for coverage of leading indicator series from around the world.
IMF Asked to Aid G-8 With Exit Strategies For Crisis Policies can be found here.
| Business Cycle Indicators (%) | May | April | March | Feb. 6-Month % (AR) | 2008 | 2007 | 2006 |
|---|---|---|---|---|---|---|---|
| Leading | 1.2 | 1.1 | -0.3 | 2.4 | -2.8 | -0.3 | 1.5 |
| Coincident | -0.2 | -0.3 | -0.7 | -6.4 | -0.8 | 1.6 | 2.5 |
| Lagging | -0.2 | -0.8 | -0.6 | -4.0 | 2.9 | 2.8 | 3.3 |

Tom Moeller
AuthorMore in Author Profile »Prior to joining Haver Analytics in 2000, Mr. Moeller worked as the Economist at Chancellor Capital Management from 1985 to 1999. There, he developed comprehensive economic forecasts and interpreted economic data for equity and fixed income portfolio managers. Also at Chancellor, Mr. Moeller worked as an equity analyst and was responsible for researching and rating companies in the economically sensitive automobile and housing industries for investment in Chancellor’s equity portfolio. Prior to joining Chancellor, Mr. Moeller was an Economist at Citibank from 1979 to 1984. He also analyzed pricing behavior in the metals industry for the Council on Wage and Price Stability in Washington, D.C. In 1999, Mr. Moeller received the award for most accurate forecast from the Forecasters' Club of New York. From 1990 to 1992 he was President of the New York Association for Business Economists. Mr. Moeller earned an M.B.A. in Finance from Fordham University, where he graduated in 1987. He holds a Bachelor of Arts in Economics from George Washington University.