 Global| Apr 09 2009
U.S. Initial Claims for Jobless Insurance Back Off From High; Continuing Claims Double Last Year's Level
by:Tom Moeller
|in:Economy in Brief
Summary
Though they may be topping, initial claims for unemployment insurance certainly remain high. At 654,000 last week that was down from an upwardly revised 675,000 during the prior week. However, the level was up 82.7% from one year ago. [...]
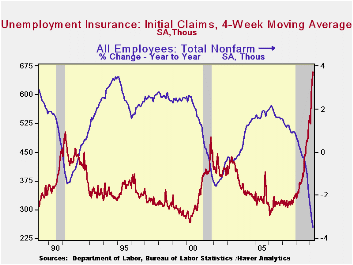
Though they may be topping, initial claims for unemployment insurance certainly remain high. At 654,000 last week that was down from an upwardly revised 675,000 during the prior week. However, the level was up 82.7% from one year ago. Consensus expectations for 660,000 claims.
The Labor Department indicated that the largest increases in initial claims for the week ending March 28 were in Kentucky (+5,029), Michigan (+4,428), Illinois (+3,498), Ohio (+3,000), and Tennessee (+2,718), while the largest decreases were in California (-7,057), Pennsylvania (-3,302), Missouri (-2,193), Kansas (-1,726), and Minnesota (-1,559).
Continuing claims for unemployment insurance reached yet another record high of 5,840,000 and remained double that of last March. The series dates back to 1966. The four-week average of continuing claims also rose to another record of 5,647,500. Continuing claims provide some indication of workers' ability to find employment and they lag the initial claims figures by one week.
Though the latest level of continuing claims was a record, the labor force has grown as well, by nearly 30% over the last twenty years. Therefore, the insured rate of unemployment is not at a record high. It rose slightly to 4.4% which was the highest since 1983. During the last ten years there has been a 93% correlation between the level of the insured unemployment rate and the overall rate of unemployment published by the Bureau of Labor Statistics.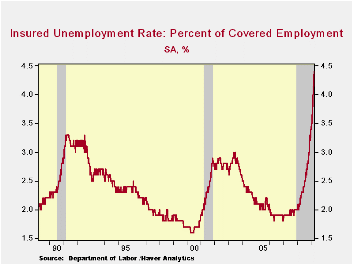
The 4.4% insured unemployment rate by far understates labor market distress in some states. The highest insured unemployment rates in the week ending March 21 were in Michigan (7.7 percent), Oregon (7.6), Rhode Island (7.5), Puerto Rico (7.2), Idaho (7.0), Wisconsin (6.9), Pennsylvania (6.5), Montana (6.0), Nevada (6.0), and Vermont (6.0).
The unemployment insurance claim data is available in Haver's WEEKLY database.
The Outlook for Productivity Growth: Symposium Summary from the Federal Reserve Bank of San Francisco is available here.
| Unemployment Insurance (000s) | 04/04/09 | 03/28/09 | 03/21/09 | Y/Y | 2008 | 2007 | 2006 |
|---|---|---|---|---|---|---|---|
| Initial Claims | 654 | 674 | 657 | 82.7% | 420 | 321 | 313 |
| Continuing Claims | -- | 5,840 | 5,745 | 99.8% | 3,342 | 2,552 | 2,459 |

Tom Moeller
AuthorMore in Author Profile »Prior to joining Haver Analytics in 2000, Mr. Moeller worked as the Economist at Chancellor Capital Management from 1985 to 1999. There, he developed comprehensive economic forecasts and interpreted economic data for equity and fixed income portfolio managers. Also at Chancellor, Mr. Moeller worked as an equity analyst and was responsible for researching and rating companies in the economically sensitive automobile and housing industries for investment in Chancellor’s equity portfolio. Prior to joining Chancellor, Mr. Moeller was an Economist at Citibank from 1979 to 1984. He also analyzed pricing behavior in the metals industry for the Council on Wage and Price Stability in Washington, D.C. In 1999, Mr. Moeller received the award for most accurate forecast from the Forecasters' Club of New York. From 1990 to 1992 he was President of the New York Association for Business Economists. Mr. Moeller earned an M.B.A. in Finance from Fordham University, where he graduated in 1987. He holds a Bachelor of Arts in Economics from George Washington University.
More Economy in Brief


