 Global| Feb 20 2009
U.S. CPI Ticked Up
by:Tom Moeller
|in:Economy in Brief
Summary
During February the consumer price index (CPI-U) rose for the first month since July, according to the U.S. Bureau of Labor Statistics. The 0.3% gain followed drops of 0.8% and 1.7% during December and November. Due to those earlier [...]
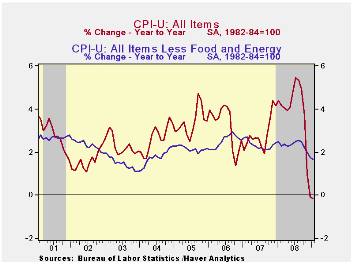 During
February the consumer price index (CPI-U) rose for
the first month since July, according to the U.S. Bureau of Labor
Statistics. The 0.3% gain followed drops of 0.8% and 1.7% during
December and November. Due to those earlier sharp declines the
three-month rate of change remained quite weak at -8.4% (AR). The
latest increase matched Consensus expectations.
During
February the consumer price index (CPI-U) rose for
the first month since July, according to the U.S. Bureau of Labor
Statistics. The 0.3% gain followed drops of 0.8% and 1.7% during
December and November. Due to those earlier sharp declines the
three-month rate of change remained quite weak at -8.4% (AR). The
latest increase matched Consensus expectations.
A 1.7% rise in energy prices led last month's increase in the CPI after having been down during the previous five months. Gasoline prices reversed earlier declines with a 6.0% (-40.4% y/y) increase to an average of $1.79 per gallon of regular. Still moving lower last month, however, were fuel oil prices which fell 2.7% (-19.5% y/y). It was their sixth consecutive monthly drop while prices for natural gas & electricity fell 0.8% m/m (+7.2% y/y).
Increases in food & beverage prices have very much tapered off from their strong gains earlier this year. A 0.1% uptick followed a like gain during December. That pulled the three month annual rate of increase down to 1.4% after growth as high as 8.7% this summer. Outright declines in meat and dairy product prices as well as much easier growth in cereal & bakery product costs account for the moderation.
 Core prices (CPI less food and energy)
showed their strongest increase since August with a 0.2%
rise. However, despite the increase the year-to-year gain of
1.7% remained its weakest since mid-2004. Little or no growth in core
prices during the prior four months accounts for the moderation.
Core prices (CPI less food and energy)
showed their strongest increase since August with a 0.2%
rise. However, despite the increase the year-to-year gain of
1.7% remained its weakest since mid-2004. Little or no growth in core
prices during the prior four months accounts for the moderation.
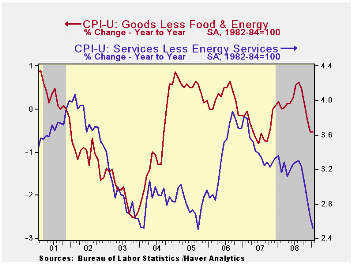
Core goods prices rose for the first time since July. The 0.3% increase reversed the prior month's decline but nevertheless left the three-month rate of change at a negative 0.9%. Prices of new & used motor vehicles increased for the first time in a year, but the 0.2% rise left them down 3.2% during that period. Lower prices of used cars paced the decline with a 9.2% twelve month decrease. Apparel prices ticked up 0.3% (-0.9% y/y) while prices for household furnishings & operations ticked lower by 0.1% (+1.8% y/y). Appliance prices were up 2.0% y/y while furniture prices were unchanged y/y. Tobacco prices again were strong during January and they posted a 0.8% increase (+6.1% y/y).
Gains in core services prices continued moderate
with a 0.2% increase That left the three-month rate of increase at 1.6%
(AR) after growing at a 3.9% rate this past summer. Medical
care services prices rose 0.5% (3.0% y/y) which was their strongest
increase in twelve months. Education costs posted a 0.3%
increase and the year-to-year rise of 5.5% was stable with the growth
in recent years, though down from the 6.9% increase during
2004.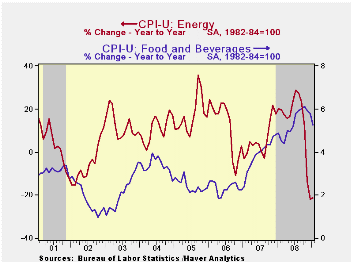 Shelter prices rose 0.2% and the y/y increase fell to
1.8%. As the housing market remained deeply depressed, owners
equivalent rent of primary residence, a measure not equivalent to other
house price measures, rose 0.3% (2.2% y/y). Public
transportation prices fell hard for the fifth consecutive month and
were unchanged year-to-year. Recreation prices also were
unchanged last month and they have been flat or down during the last
there periods, +1.6% y/y.
Shelter prices rose 0.2% and the y/y increase fell to
1.8%. As the housing market remained deeply depressed, owners
equivalent rent of primary residence, a measure not equivalent to other
house price measures, rose 0.3% (2.2% y/y). Public
transportation prices fell hard for the fifth consecutive month and
were unchanged year-to-year. Recreation prices also were
unchanged last month and they have been flat or down during the last
there periods, +1.6% y/y.
The chained CPI, which adjusts for shifts in consumption patterns, rose 0.5%, the first increase since July. Less food and energy, chained prices rose 0.2% after two months of 0.3% decline.
The consumer price data is available in Haver's USECON database while detailed figures can be found in the CPIDATA database.
House Prices and Bank Loan Performance from the Federal Reserve Bank of San Francisco can be found here.
Labor Supply Responses to Changes in Wealth and Credit also from the Federal Reserve Bank of San Francisco is available here.
| Consumer Price Index (%) | January | December | Y/Y | 2008 | 2007 | 2006 |
|---|---|---|---|---|---|---|
| Total | 0.3 | -0.8 | -0.2 | 3.8 | 2.9 | 3.2 |
| Total less Food & Energy | 0.2 | 0.0 | 1.7 | 2.3 | 2.3 | 2.5 |
| Goods less Food & Energy | 0.1 | -0.2 | -0.5 | 0.1 | -0.4 | 0.2 |
| Services less Energy | 0.2 | 0.1 | 2.5 | 3.1 | 3.4 | 3.4 |
| Energy | 1.7 | -9.3 | -21.1 | 13.5 | 5.7 | 11.0 |
| Food & Beverages | 0.1 | 0.1 | 5.2 | 5.4 | 3.9 | 2.3 |
| Chained CPI: Total (NSA) | 0.5 | -1.3 | -0.5 | 3.3 | 2.5 | 2.9 |
| Total less Food & Energy | 0.2 | -0.3 | 1.2 | 2.0 | 2.0 | 2.2 |

Tom Moeller
AuthorMore in Author Profile »Prior to joining Haver Analytics in 2000, Mr. Moeller worked as the Economist at Chancellor Capital Management from 1985 to 1999. There, he developed comprehensive economic forecasts and interpreted economic data for equity and fixed income portfolio managers. Also at Chancellor, Mr. Moeller worked as an equity analyst and was responsible for researching and rating companies in the economically sensitive automobile and housing industries for investment in Chancellor’s equity portfolio. Prior to joining Chancellor, Mr. Moeller was an Economist at Citibank from 1979 to 1984. He also analyzed pricing behavior in the metals industry for the Council on Wage and Price Stability in Washington, D.C. In 1999, Mr. Moeller received the award for most accurate forecast from the Forecasters' Club of New York. From 1990 to 1992 he was President of the New York Association for Business Economists. Mr. Moeller earned an M.B.A. in Finance from Fordham University, where he graduated in 1987. He holds a Bachelor of Arts in Economics from George Washington University.
More Economy in Brief


