 Global| Feb 18 2010
Philadelphia Fed Index Increases With Broad-Based Component Strength
by:Tom Moeller
|in:Economy in Brief
Summary
The Philadelphia Federal Reserve Bank indicated that its index of regional factory sector activity rose modestly this month and made up some of a January decline. At 17.6 the index about matched Consensus expectations and has been [...]
 The
Philadelphia Federal Reserve Bank indicated that its index of regional
factory sector activity rose modestly this month and made up some of a
January decline. At 17.6 the index about matched Consensus expectations
and has been positive since the summer. The series was near its highest
level since early-2005 and compared to figures near -40.0 this past
fall and winter.
The
Philadelphia Federal Reserve Bank indicated that its index of regional
factory sector activity rose modestly this month and made up some of a
January decline. At 17.6 the index about matched Consensus expectations
and has been positive since the summer. The series was near its highest
level since early-2005 and compared to figures near -40.0 this past
fall and winter.
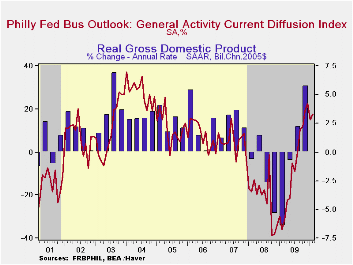
During the last ten years there has been a 77% correlation between the level of the Philadelphia Fed Business Conditions Index and the three-month growth in factory sector industrial production. There has been a 70% correlation with q/q growth in real GDP. The latest survey from the Philadelphia Federal Reserve Bank can be found here.
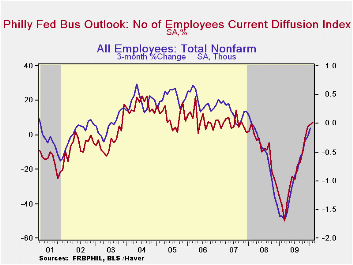
Amongst the components, new orders, shipments and inventories were notably strong above break-even. The employment series also rose to its highest since 2007. During the last ten years there has been a 91% correlation between the index level and the three-month change in manufacturing sector payrolls.
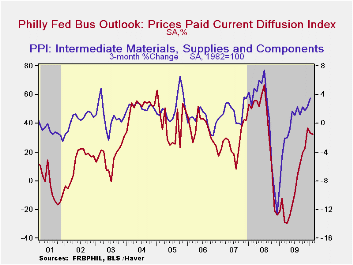
The prices paid index rose sharply to its highest level since August of last year and compares to negative readings this past winter and spring. During the last ten years there has been a 69% correlation between the prices paid index and the three-month growth in the intermediate goods PPI. There has been an 80% correlation with the change in core intermediate goods prices.
The separate index of expected business conditions in six months fell to its lowest level since October 2008. Many of the index components including orders, unfilled orders, delivery times and inventories fell while shipments and capital expenditures rose.
The figures from the Philadelphia Federal Reserve can be found in Haver's SURVEYS database.
News About the Future and Economic Fluctuations from the Federal Reserve Bank of Philadelphia can be found here.
| Philadelphia Fed (%) | February | January | December | February '09 | 2009 | 2008 | 2007 |
|---|---|---|---|---|---|---|---|
| General Activity Index | 17.6 | 15.2 | 22.5 | -36.1 | -7.6 | -21.4 | 5.0 |
| New Orders | 22.7 | 3.2 | 8.3 | -28.1 | -9.7 | -14.7 | 6.9 |
| Number of Employees | 7.4 | 6.1 | 4.5 | -41.1 | -23.8 | -8.8 | 6.8 |
| Inventories | 3.2 | -1.6 | -5.7 | -25.2 | -24.0 | -16.7 | -3.7 |
| Prices Paid Index | 32.4 | 33.2 | 36.6 | -12.2 | -3.9 | 36.3 | 26.3 |

Tom Moeller
AuthorMore in Author Profile »Prior to joining Haver Analytics in 2000, Mr. Moeller worked as the Economist at Chancellor Capital Management from 1985 to 1999. There, he developed comprehensive economic forecasts and interpreted economic data for equity and fixed income portfolio managers. Also at Chancellor, Mr. Moeller worked as an equity analyst and was responsible for researching and rating companies in the economically sensitive automobile and housing industries for investment in Chancellor’s equity portfolio. Prior to joining Chancellor, Mr. Moeller was an Economist at Citibank from 1979 to 1984. He also analyzed pricing behavior in the metals industry for the Council on Wage and Price Stability in Washington, D.C. In 1999, Mr. Moeller received the award for most accurate forecast from the Forecasters' Club of New York. From 1990 to 1992 he was President of the New York Association for Business Economists. Mr. Moeller earned an M.B.A. in Finance from Fordham University, where he graduated in 1987. He holds a Bachelor of Arts in Economics from George Washington University.
More Economy in Brief


