 Global| Nov 30 2010
More Reports on GDP; Q/Q vs Y/Y
Summary
More information on the economic performance of individual countries in the third quarter of this year is becoming available. Third quarter GDP for two developed economies, Canada and Denmark, and three emerging economies, India, [...]
 More
information on the economic performance of individual countries in the
third quarter of this year is becoming available. Third quarter
GDP for two developed economies, Canada and Denmark, and three emerging
economies, India, Poland and Slovenia were released today.
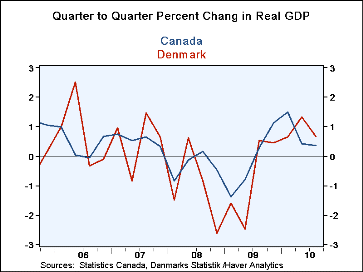
Previously released date revealed that, except for countries in the Far East, most other countries experienced a slow down in the third quarter. The new information is in line with these trends. Growth in Canada, Denmark, Poland and Slovenia decelerated while in India it accelerated, as can be seen in the first and second charts.
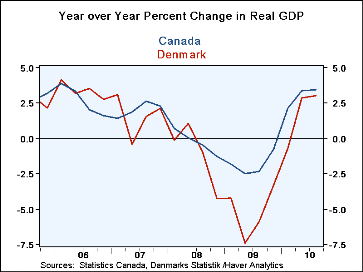
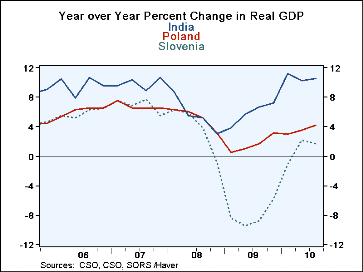
Q/Q rates of growth are of interest to analysts concerned with short term trends, but to those who want to compare annual growth rates, the Y/Y rates of growth are, obviously, the appropriate choice. Canada and Denmark are currently experiencing annual growth of 3.4% and 3.0%, respectively. India's growth rate is a remarkable 10.6% and Poland is posting a respectable 4.2%-4.8% (See notes (1) and (2) below). Slovenia is slowly recovering from its steep recession, and has averaged only a 2% annual rate of growth in the last two quarters. The Y/Y rates of growth for the five countries are shown in the third and fourth charts.


